


The indicator determines the short -, medium – and long-term highs and lows of the market according to the method described by Larry Williams in the book “Long-term secrets of short-term trading”.
The indicator determines the short -, medium – and long-term highs and lows of the market according to the method described by Larry Williams in the book “Long-term secrets of short-term trading”.
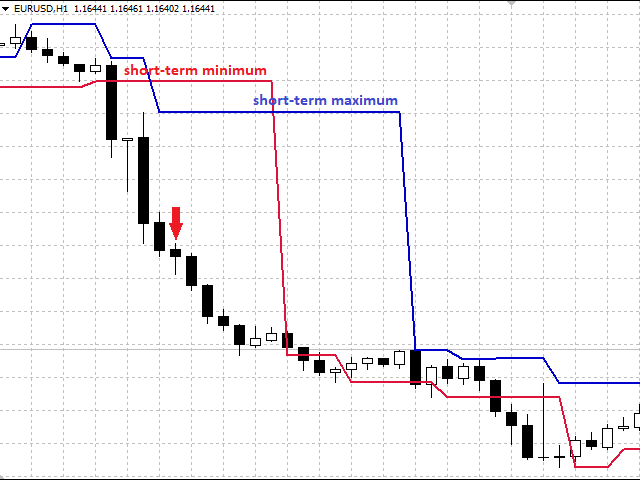
The short-term high is the high of a bar with lower highs on either side of it, and vice versa – the short-term low of a bar is the low with higher lows on either side of it. Medium-term highs and lows are determined by analogy: a medium-term high is a short-term high, on both sides of which lie lower short-term highs, a medium-term low is a short-term low, on both sides of which lie higher short-term lows. Long-term extremes are determined by the same principle, depending on the nearest medium-term highs and lows. The analysis of bars does not take into account internal bars with a lower high price and a higher low price than the previous bar. Thus, short-term extremes are determined with a delay of at least one bar.
The position of the price of a financial instrument relative to the indicator lines, as well as the position of the indicator lines relative to each other, gives an idea of the trend development, allows you to quickly find support and resistance levels, determine the potential for price growth (fall) by long-term highs and lows. This indicator will be useful when creating automated trading systems, as it can be used to quickly determine the direction of the trend by software tools.
[spoiler title=”Read More…”]
A price rebound from a high or low is a confirmation of the presence of a price level of resistance or support and a signal to open trades in the event of a subsequent breakdown or rebound from this level. You can also read about the input signals in the book by Larry Williams.
The indicator does not redraw the lines when they are broken by the price and does not change the position of the medium – and long-term highs (lows). If the short-term maximum (minimum) is above (below) it, it makes it possible to determine the trend by the position of the indicator lines relative to each other. In some cases, when forming an external bar, the short-term minimum may be higher than the short-term maximum, this is not an error in the logic of the indicator, it can serve as an entry point to a short or long position (see Figure 1). This principle is used in signals of the first type of the SRVector indicator.
- Show short – term extremes-control the display of short-term levels;
- Show medium – term extremes-controls the display of medium-term levels;
- Show long – term extremes-controls the display of long-term levels;
- Prices for building extremes-build levels at high and low prices, or at the prices of open and close bars.
[/spoiler]