


The indicator selects a trend from a sequence of prices and builds its forecast. Based on the modern methodSingular Value Spectral Analysis (SSA). The FSA is used to identify the main components (trend, seasonal and wave fluctuations), smooth out and suppress noise. It does not require the stationarity of the series, information about the presence of periodic components and their periods. Applicable to price series and data from other indicators.
The implementation using the FFT algorithm allowed more than 50 times faster data processing, in contrast to the usual approach implemented in SSA Trend Predictor.
Price dynamics is presented as a process caused by the influence of factors of different scales and additional “noise”. Factors of influence determine the trend and the pattern of price changes, noise-oscillations hide useful information. The FSA – “Caterpillar” processing method allows you to separate the subspaces of the signal and noise, to assess the contribution and scale of significant influence factors. The selected “signal” has no phase delays, in contrast to the methods of conventional filtering and smoothed average. Based on the detected trends and periodicities, a forecast is made. Forecasting based on a well-chosen model is a hedging method in a trading strategy.
[spoiler title=”Read More…”]
Controlling the indicator parameters allows you to adjust the smoothness of the selected trend and control the noise filtering threshold, take into account or suppress the contribution from the components in the signal acting on different time scales. The optimal decomposition of data into signal and noise components is determined by the time horizon of the trading strategy and the current market situation.
According to the constructed model, the forecast of subsequent values is made, taking into account the statistical characteristics of the data and the best within the model. It should be borne in mind that the remaining “overboard” factors of influence can be very significant. An adequate model is a good forecast. You should focus on a qualitative, rather than quantitative, forecast of price fluctuations and use it as a hedging signal.
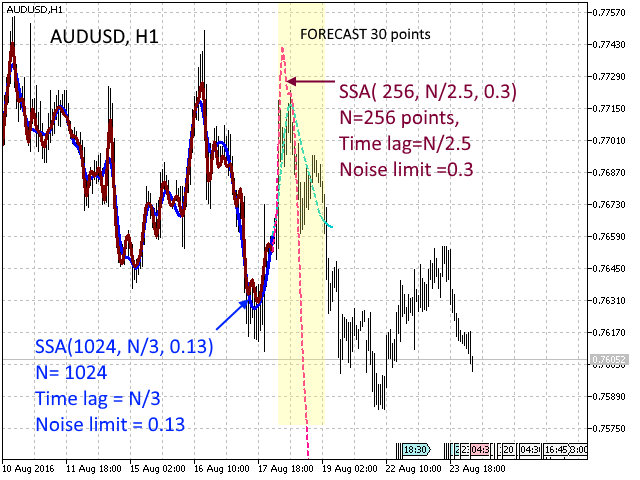
The length of the price series fragment (N) is selected in the range 216 – 2048 based on the statistical uniformity of the data.
The best window of influence of the previous N/2 is N/3.
Noise filter parameter Noise HF Limit: the longer the row, the smaller the filter parameter. For short fragments, the estimation of statistical properties is performed with an increased error-the level should be increased.
In the configured model, the number of prediction points with an acceptable prediction probability is 10-30 points. For a long-range forecast, it is reasonable to use a coarser timeframe. The simultaneous use of two indicators with different parameters (N=1024 and 512) will indicate the divergence of the influence of factors associated with different time scales, or confirm the forecast.
[/spoiler]