


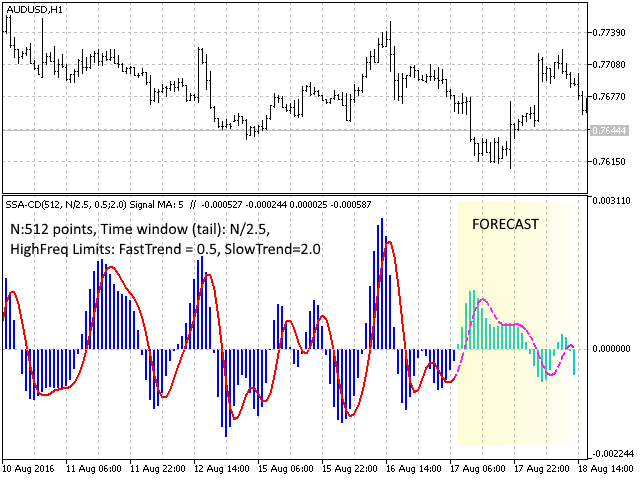

SSACD – Singular Spectral Average Convergence/Divergence
An analog of the MACD indicator based on Singular Spectral Analysis (SSA).
SSA is an effective method for processing non-stationary time series with an unknown internal structure. It is used for determining the main components (trend, seasonal and wave fluctuations), smoothing and noise suppression. The method allows you to find previously unknown periodicities of a series and make a forecast based on the detected periodic patterns.
The highlighted smoothed price fluctuations do not have a time delay relative to the original series, unlike the MACD, which uses moving averages. Accordingly, this indicator eliminates the drawback of the MACD, such as lag, and more accurately and synchronously reflects the variability of the behavior of the price series. The constructed forecast for the selected “fast” and “slow” price fluctuations takes into account the set of detected multi-scale factors that form the “wave” behavior of a number of data and can be used to reduce risks in the strategy.
The characteristic behavior, signals, and interpretation of the indicator correspond to the same properties of the linear MACD.
Explanation of the set of parameters
[spoiler title=”Read More…”]
The influence window limits the number of previous points that affect the current price. It is reasonable to choose s = 1 or 2.
The high frequency limit for determining” averages ” indicates the contribution of RF noise to the overall variance of a number of prices (in percent). For a fast oscillating average, it is 0.5 – 1.5, for a slow one 1.5 – 4. All the oscillations whose contribution does not exceed this level will be filtered out.
BacwardShift is designed to shift calculations along a series of data in order to compare the forecast with known prices and select the indicator parameters.
Data preparation is a method of modifying a series of prices to a different sequence in order to improve the results of the forecast on a specific timeframe.
P.S. Visualization of individual trends along the price chart is available using the SSA Trend Predictor indicator.
[/spoiler]