


The product displays DAILY reference points and is useful for DAY TRADERS who trade on intraday timeframes (M1, M5, M15, M30, H1 and H4) in the MT4 platform.
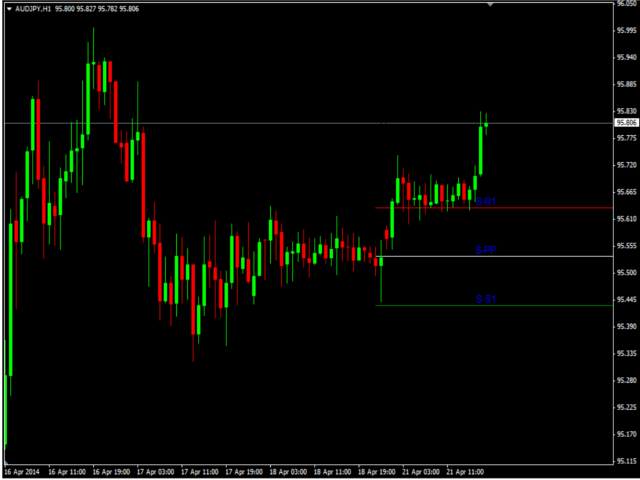
- Dynamically calculates and displays daily reference points (center reference point, R1, R2, R3, S1, S2, and S3)
- There is an option to calculate and display the midpoints
- Daily reference points are displayed regardless of the intraday timeframe you are using (M1, M5, M15, M30, H1 or H4). Daily reference points do not change when the timeframe changes
- The values for the previous days are stored in the buffer and can be viewed in the data window. This is especially useful if you want to understand how the price behaves near the reference points
- Fully configurable options (see the section ” Input parameters”)
- Can send daily emails about the detection of reference points
- It can send daily notifications to the mobile terminal about the detection of reference points
- It can be used in Expert Advisors that use iCustom to get data from the corresponding buffer (see the section ” Indicator buffers”)
- SendEmail-sending an email to the address specified in MT4
- PushNotification – push notification to the mobile terminal
- drawPP – Drawing the Pivot Point
- drawR1 – rendering Resisitance 1
- drawR2 – rendering Resisitance 2
- drawR3 – rendering Resisitance 3
- drawS1 – Drawing Support 1
- drawS2 – Support 2 rendering
- drawS3 – Support 3 rendering
- drawMidPoint – Drawing Mid Points
- lineDisplay-draw pivot levels on the entire chart or just on the right side
- midpointlinecolor – the color of the Mid Points line
- midpointlinestyle-the style of the Mid Points line
- pivotpointlinecolor – the color of the Central Pivot Point line
- pivotpointlinestyle – color of the Central Pivot Point line
- supportlinecolor – the color of the support lines (S1, S2, and S3)
- supportlinestyle-the style of the support lines (S1, S2, and S3)
- resistancelinecolor – color of the resistance lines (R1, R2, and R3)
- resistancelinestyle-the style of the resistance lines (R1, R2 and R3)
- labeltextfontsize – font size of the text caption
- linelabelcolor – the color of the text caption
- textlabelposition – position of the text signature
[spoiler title=”Read More…”]
- The indicator saves you time by eliminating the need to manually calculate daily reference points. You can find out how the Pivot Point Plotter (PPP) product series can save you time and money in the corresponding section of the description (“How the PPP product series saves time and money”)
- The product uses data from your broker’s platform, so you don’t need to rely on previously calculated reference points found somewhere on the Internet and possibly different from your broker’s data
- The indicator is fully configurable. You can enable the display of only the reference points that you use in your strategy (see the full list of configurable options in the “Input parameters” section”)
- The indicator can be used with all symbols in MetaTrader 4
- Buffer 0 – central reference point
- Buffer 1 – Resistance 3
- Buffer 2 – Resistance 2
- Buffer 3 – Resistance 1
- Buffer 4 – Support 1
- Buffer 5 – Support 2
- Buffer 6 – Support 3
Assume the following:
These assumptions are reasonable and very conservative. Now let’s calculate how much time and money you would save by using the Daily Pivot indicator during the year.
The time spent on calculating and drawing reference points during the month = 5 * 20 = 100 minutes (20 trading days per month). Time spent calculating and drawing reference points during the year = 100 * 12 (months per year) = 1,200 min. 1,260 min. = 1200/60 = 20 hours. Let’s convert this time into money: 20 * 7.25 = $ 145.
So, according to the most conservative estimates, you spend 20 hours a year calculating and drawing reference points. The time spent would bring you an additional $ 145.
If you trade two pairs, this amount would be$ 290 per year, and with three currency pairs – $435. Imagine how much you will earn when trading 5 or more pairs.
This way, you can calculate how much time and money is spent on what you think is the easiest activity in the world.
Manage your time wisely. Run the Standard Pivot Point Plotter, and it will do the most time-consuming work of calculating and drawing daily reference points for you.
[/spoiler]