


Stochastic Dashboard is a dashboard that gives you a global view of the market using stochastic.
Stochastic Dashboard analyzes and tracks all the assets you work with. The panel allows you to open the chart in a few seconds and start working in it.
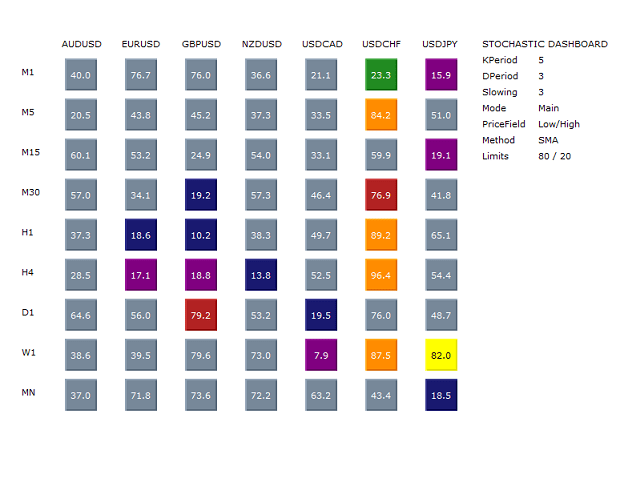
- A graphical dashboard that allows you to view the situation on many assets.
- Seven different stochastics to determine whether an asset is overbought/oversold.
- Alerts, emails, and notifications that allow you to search for new market opportunities.
- All stochastic parameters, including overbought and oversold levels, are fully configurable.
- You can also choose whether the calculation should be made at the close of the candle or on the current candle.
The colors and alerts of the indicator are shown in the Colors and Alerts figure.
All alerts notify you of the situation once per candle. When an overbought/oversold signal appears, alerts are sent when the indicator is located in the corresponding zone. The demo version is limited to one asset due to the limitations of the strategy tester.
- Main Stochastic Settings (basic settings of the stochastic)
- K Period – period K
- D Period – Period D
- Slowing – slowing down
- Mode-mode: Main (main) or Signal (signal)
- Price Field (Low/High or Close/Close) – price area (low/High or Open / Close)
- Method (Simple, Exponential, Smoothed or Linear Weighted) – Method (Simple, Exponential, Smoothed or linearly weighted)
- Close Candle (the stochastic is displayed after the candle is closed or on the current one)
- Stochastic Levels (levels stochastic)
- Up Level – upper level
- Down Level – lower level
- Symbols and TimeFrames)
- Symbols (displayed characters are separated by”; ” without spaces)
- Time Frames (displayed timeframes are separated by “;” without spaces, supported timeframes M1, M5, M15, M30, H1, H4, D1, W1 and MN)
- Alerts and Emails)
- Buy / Sell Alert, Mail or Notification-enable / disable alerts, emails, and buy/sell notifications
- Overbought / Sold Alert, Mail or Notification-enable / disable alerts, emails, and overbought/oversold notifications
- Cross Overbought / Sold Alert, Mail or Notification-enable / disable alerts, emails, and notifications when overbought/oversold levels cross
- Graphs (notation)
- Font Color – font color
- Display Indicator Data – display indicator data (enable / disable additional information about stochastics and its settings)
[spoiler title=”Read More…”]
- K Period – period K
- D Period – Period D
- Slowing – slowing down
- Mode-mode: Main (main) or Signal (signal)
- Price Field (Low/High or Close/Close) – price area (low/High or Open / Close)
- Method (Simple, Exponential, Smoothed or Linear Weighted) – Method (Simple, Exponential, Smoothed or linearly weighted)
- Close Candle (the stochastic is displayed after the candle is closed or on the current one)
- Up Level – upper level
- Down Level – lower level
- Symbols (displayed characters are separated by”; ” without spaces)
- Time Frames (displayed timeframes are separated by “;” without spaces, supported timeframes M1, M5, M15, M30, H1, H4, D1, W1 and MN)
- Buy / Sell Alert, Mail or Notification-enable / disable alerts, emails, and buy/sell notifications
- Overbought / Sold Alert, Mail or Notification-enable / disable alerts, emails, and overbought/oversold notifications
- Cross Overbought / Sold Alert, Mail or Notification-enable / disable alerts, emails, and notifications when overbought/oversold levels cross
- Font Color – font color
- Display Indicator Data – display indicator data (enable / disable additional information about stochastics and its settings)
[/spoiler]