


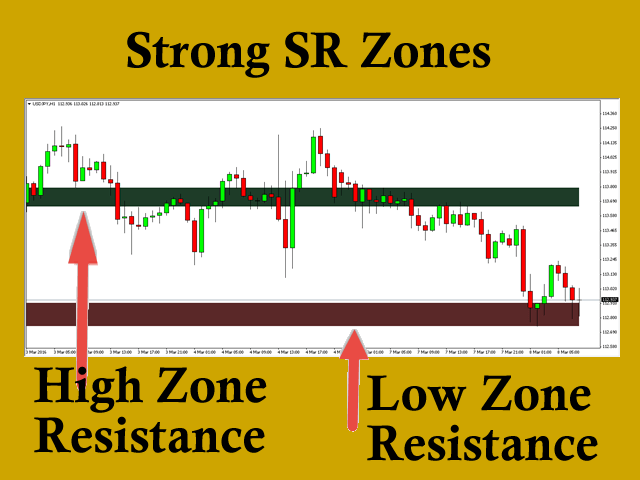

- High Zone – the top zone, the green rectangle on the graph. when the candle closes within the green rectangle, the cost can bounce back and forth within it until it breaks through the upper or lower line of the rectangle. If the height of the rectangle is more than 20 pips, you can use the rebound and take 5-10 pips. When the candle closes near the lower line, you can open a long BUY position. When the candle closes near the upper line, you can open a short SELL position.
- Low Zone – the lower zone, the red rectangle on the chart. If the candle closes inside the red rectangle, the price can bounce back and forth inside it until it breaks through the upper or lower line of the rectangle. If the height of the rectangle is more than 20 pips, you can use the rebound and take 5-10 pips. When the candle closes near the lower line, you can open a long BUY position. When the candle closes near the upper line, you can open a short SELL position.
- It has no incoming parameters
- If you have any questions about the indicator, please send me a private message.