


The full version is available here.
A version of the panel is also available at the link.
Dashboard Super Exit Demo is a demo version of the Dashboard Super Exit, which has the full functionality of the paid version with the exception of the following:
- Only two support/resistance levels (the daily pivot and the weekly pivot) are used to calculate the risk / profit ratio.)
- The Sell button is not available
- The ability to select support/resistance levels to calculate the risk-to-profit ratio
- Adjustable position of the indicator panel
- Magic No – Magic number
- Lot Size – lot size
- Use Pivot Support – use Pivot support
- Use pivot support to calculate the risk-to-profit ratio
- The same rule applies to the next six support/resistance levels
- Use Pivot Resistance – use pivot resistance
- Use Daily Pivot – use the daily pivot
- Use Weekly Pivot – use the weekly pivot
- Use Monthly Pivot – use monthly Pivot
- Use Previous Daily High – use the previous daily high
- Use Previous Daily Low – use the previous daily low
- X_axis: position of the panel on the X-axis
- Y_axis: Y-axis position of the panel
- Use pivot support to calculate the risk-to-profit ratio
- The same rule applies to the next six support/resistance levels
[spoiler title=”Read More…”]
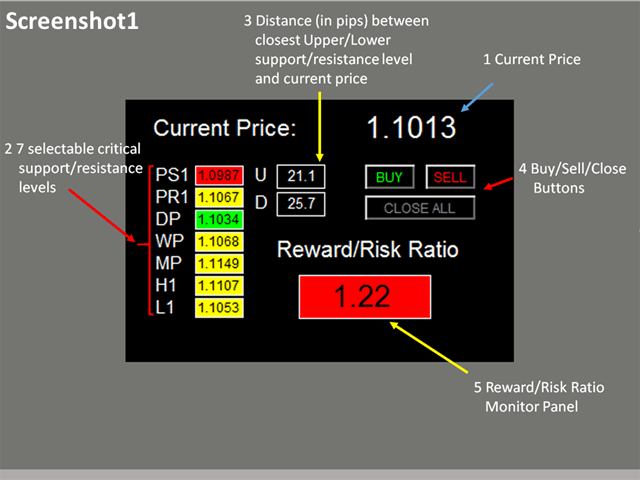
See the screenshot:
- Pivot S1
- Pivot R1
- Daily Pivot
- Weekly pivot
- Monthly pivot
- Previous daily High
- Previous daily low
- If the price rises above all the selected levels, NA will be displayed in cell U
- If the price falls above all the selected levels, NA will be displayed in cell D
- Click the buy/sell button to place the corresponding order. Stop-loss and take-profit orders are set at a higher level
- Click the close button to close all orders with the magic number of the Expert Advisor
- The number on the panel indicates the risk-to-profit ratio. If the price rises/falls above/below all the selected levels, the panel displays ‘NA’
- If (current price – nearest lower level) > (nearest upper level – current price), the panel is colored red
- If (nearest upper level – current price) > (current price-nearest lower level), the panel is colored green
If you have any individual request and / or suggestion, please contact me.
If you have any individual request and / or suggestion, please contact me.
[/spoiler]