


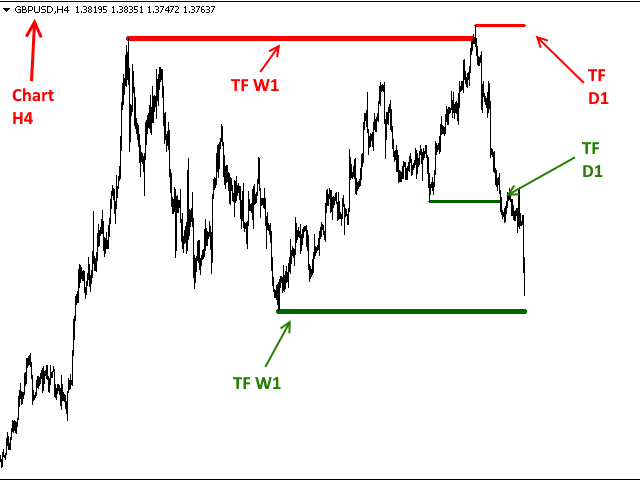

The indicator shows the last untouched support and resistance levels in the form of horizontal lines. The indicator can show support/resistance levels from higher timeframes. With this indicator, you can easily see the support/resistance levels from the H4, D1 and W1 timeframes on the H1 chart, which can be a big advantage when looking for entry opportunities on H1.
This is the full version of the indicator: Support Resistance Multi Time Frame FREE
- referenceTF: timeframe for calculating support/resistance levels
- colorResistance: color of the resistance line
- colorSupport: Support line color
- widthOfLines: the thickness of the lines (from 1 to 5). The different line thickness helps to distinguish the support/resistance levels of different timeframes.