


The Swing High Low Pattern Recognition indicator recognizes swing high and swing low patterns, which allows you to set price levels and analyze market fluctuations.
The Swing High Low indicator uses a dynamic approach to analysis, which makes it easy to find the best levels to enter.
The indicator uses the minimum and maximum periods of the previous candlesticks to analyze the impulse movement and sets the entry levels.
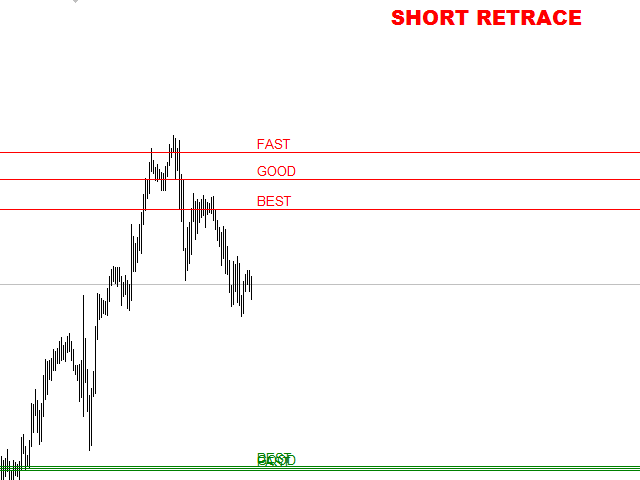
At the same time, the indicator displays three types of levels: fast, good and best. The best input is the last swing confirmation.
For proper use, it is recommended to wait for the full formation of the levels, and then evaluate the rollback from these levels.
The indicator automatically updates the minimum and maximum, helping to better monitor market fluctuations.
We believe that the Swing High Low indicator is a great helper, helping to find ideas for managing the market.
- Type:
- Use_TimeFrame (the indicator calculates fluctuations from the beginning of the timeframe)
- Use_Start_Time (the indicator starts calculating from the specified date, displayed vertically on the chart as a line)
- TimeFrame Period – timeframe
- Calculation Start Line Settings
- Start Line Color – the color of the line
- Start_Line_Style – line style
- Start_Line_Width – line thickness
- LINE SETTINGS – line settings
- Show_Fast_Line (true/false) – display the fast level line on the chart
- Show_Good_Line (true/false) – display a good level line on the chart
- Show_Best_Line (true/false) – display the best level line on the chart
- High Color-Low Color-adjust line colors
- FGB_Line_Style – FGB_Line_Width-line style
- Signature Settings
- Show_Signal (true/false) – display captions on the chart
- X-Y-label position
- FONT_SIZE_LABEL – font size
- Sell Color-Buy Color-Flat-the color of the signal label
- Shift_Label – Label_Font – Label_Font_Size-label settings
[spoiler title=”Read More…”]
- Use_TimeFrame (the indicator calculates fluctuations from the beginning of the timeframe)
- Use_Start_Time (the indicator starts calculating from the specified date, displayed vertically on the chart as a line)
- Start Line Color – the color of the line
- Start_Line_Style – line style
- Start_Line_Width – line thickness
- Show_Fast_Line (true/false) – display the fast level line on the chart
- Show_Good_Line (true/false) – display a good level line on the chart
- Show_Best_Line (true/false) – display the best level line on the chart
- High Color-Low Color-adjust line colors
- FGB_Line_Style – FGB_Line_Width-line style
- Show_Signal (true/false) – display captions on the chart
- X-Y-label position
- FONT_SIZE_LABEL – font size
- Sell Color-Buy Color-Flat-the color of the signal label
- Shift_Label – Label_Font – Label_Font_Size-label settings
[/spoiler]