


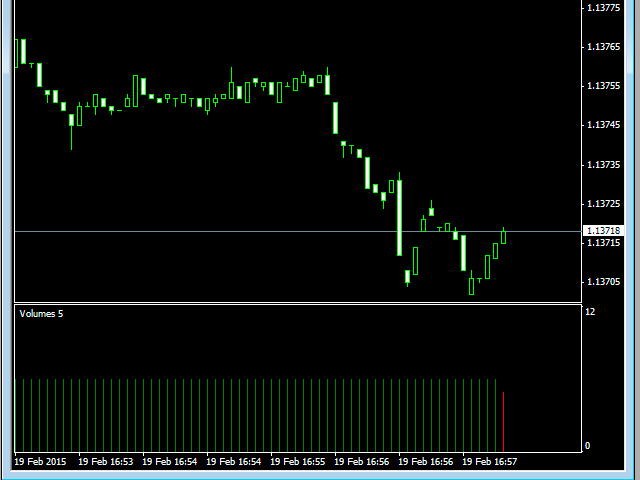

applying this indicator, you could produce charts using a fixed tick volume. info sampling is done not by
time, but by tick volume. Each bar includes a predetermined (fixed) tick volume. the tick volume can be adjusted by changing the
value of the Volume parameter. it is possible to attach indicators, Expert Advisors, and scripts into the resulting chart. It turns out a fully working
program, on which you can work in the same manner according to a regular schedule.
During operation, the indicator gathers history, but if necessary, you can reset (delete the gathered history). This is
useful when forming a chart with a different tick volume value. To perform a reset, you need to delete the global variable,
having a name corresponding to the trading instrument. The terminal has a special window for managing global variables.
To call it, you need to run the menu command “Tools-Global Variables” or press the F3 key.
The data is updated synchronously with the usual schedule, there are no delays.
You can create multiple charts at the same time.
- Volume — tick volume.
- Chart-timeframe for opening the chart in a separate window. If you are going to work with only one chart for your currency pair,
then the timeframe is not important. When plotting a chart, the timeframe does not affect the calculations. This setting is created so that you can
open multiple charts for the same currency pair, but with different settings. In this case, you need to set different timeframes
for each graph (for example, M2, M3, M4). You also need to set different timeframes when running the “Tick” indicator at the same time
Volume Chart” and other tools that generate a synthetic chart on the same currency pair.
[spoiler title=”Read More…”]
- Open the Navigator window.
- Drag the indicator to the desired chart (any timeframe).
- Open the resulting chart by clicking on the corresponding button – “Open Chart”.
[/spoiler]