


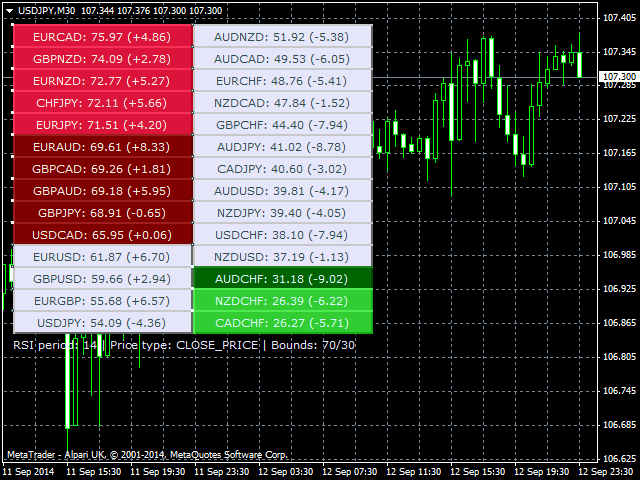

The TIL Multi RSI indicator applies the RSI to 28 currency pairs simultaneously, showing the current signals for each pair in a list of two columns. The currency pairs used consist of eight major currencies (USD, EUR, GBP, CHF, JPY, CAD, AUD, and NZD). All currency pairs are automatically sorted in the list by the signal value. The pairs with the highest value are listed from the top left, and the pairs with the lowest value are listed from the bottom right.
Let me remind you: the Relative Strength Index (RSI) is a technical indicator that determines whether an asset is in an overbought or oversold state. Its signal ranges from 0 to 100. A currency pair is considered overbought if the RSI is 70 or higher, and oversold at 30 or lower.
TIL Multi RSI allows you to easily discover trading opportunities on 28 currency pairs! It is only necessary to monitor the following properties of the indicator:
Order: The indicator displays the values of the current RSI signal for each currency pair from the maximum to the minimum. Thus, the currency pairs in the left column of the list are closer to the overbought level (70), and the currency pairs in the right column are closer to the oversold level (30).
Color: Each currency pair has its own color depending on its own RSI signal.
[spoiler title=”Read More…”]
- Bright red – the RSI is equal to or greater than 70. This is a bearish signal showing that the pair is overbought.
- Dark Red – the RSI is near the overbought level. It is necessary to monitor the status of this currency pair.
- Gray-The RSI is far from the support or resistance levels.
- Bright green – the RSI is equal to or less than 30. This is a bullish signal showing that the pair is oversold.
- Dark Green – the RSI is near the oversold level. It is necessary to monitor the status of this currency pair.
symbol is the symbol for a currency pair. – the current RSI signal of the corresponding currency pair. - /-
– the direction and magnitude of the RSI signal of the corresponding currency pair. This indicator answers the question: “In which direction is the signal directed now-up or down?” - Orientation – the amount of changes that have occurred since the last bar’s RSI signal relative to the current one.
- Positive orientation ( ) – the RSI signal of the last bar is less than the current one. In other words, the RSI of the currency pair is GROWING.
- Negative orientation (-) – the RSI signal of the last bar is greater than the current one. In other words, the RSI of the currency pair is FALLING.
- Orientation – the amount of changes that have occurred since the last bar’s RSI signal relative to the current one.
- Positive orientation ( ) – the RSI signal of the last bar is less than the current one. In other words, the RSI of the currency pair is GROWING.
- Negative orientation (-) – the RSI signal of the last bar is greater than the current one. In other words, the RSI of the currency pair is FALLING.
Let’s say a line in the list looks like: EURUSD: 71.02 ( 2.87). Knowing the transcript of all the values, we can easily interpret this entry:
- The currency pair is EURUSD.
- The current RSI signal for EURUSD is 71.02 (since the overbought level (70) is exceeded, the line should be colored bright green).
- The RSI of the EURUSD pair is growing, as, in accordance with the orientation, the RSI rose by 2.87 points.
In addition to these properties, under the list you can see some of the indicator settings, in particular, the RSI period, the price type, and the bounds.
Indicator Parameters:
- RSI period – the RSI period applied to all 28 currency pairs. The default value is 14.
- Price type – the price type on which the calculations of the RSI indicator are based. As a rule, the standard RSI indicator of the MT4 platform uses the Close price. It is also the default price type for TIL Multi RSI. All options are listed below:
- CLOSE_PRICE (default) – the closing price of the bar.
- OPEN_PRICE – the opening price of the bar (Open).
- HIGH_PRICE – the price maximum of the bar (High).
- LOW_PRICE – the price minimum of the bar (Low).
- CLOSE_PRICE (default) – the closing price of the bar.
- OPEN_PRICE – the opening price of the bar (Open).
- HIGH_PRICE – the price maximum of the bar (High).
- LOW_PRICE – the price minimum of the bar (Low).
[/spoiler]