


Introduction To Time Box Indicator
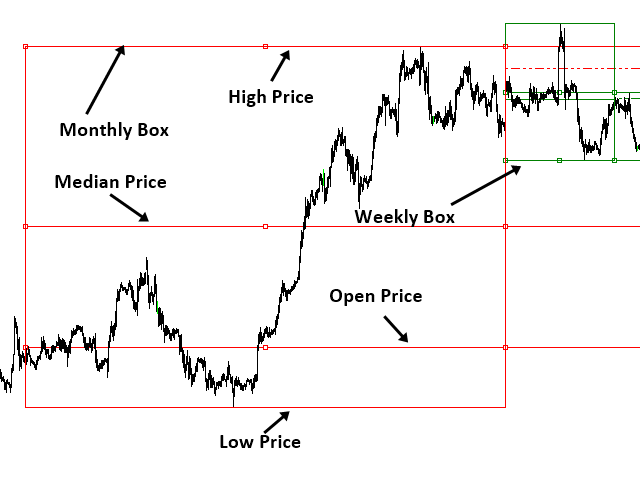
Time Box Indicator is a must have indicator for any trader. It will display daily, weekly and Monthly box according to your preferences.
Yet, you can extend any important price levels in your chart automatically. You can use them as the significant support and resistance levels.
It is very simple but effective tool for your trading.
Input for Time Box Indicator
Graphic Setting
- Use White Chart
- Line Style for Current Open price
Daily Setting
- Update Timeframe for daily box
- Number of days to display
- Days Box Color
- Days Box Width
Weekly Setting
- Update Timeframe for weekly box
- Number of weeks to display
- Weeks Box Color
- Weeks Box Width
Monthly Setting
- Update Timeframe for monthly box
- Number of months to display
- Months Box Color
- Months Box Width
License
It is free tool.
Advanced Tools for your Day Trading
- X3 Chart Pattern Scanner
- Mean Reversion Supply Demand
- Harmonic Volatility Indicator
- Elliott Wave Trend
- Equilibrium Fractal Wave Analytics
- Price Breakout Pattern Scanner
- Harmonic Pattern Plus
- Harmonic Pattern Scenario Planner
[spoiler title=”Read More…”]
Educational Books for your Day Trading
1. Profitable Chart Patterns in Forex and Stock Market
2. Scientific Guide to Price Action and Pattern Trading
Important Note
This product is the off the shelf product in the store. Therefore, we do not take any personal modification or personal customization request. For our products, we do not provide any code library or any support for your coding.
[/spoiler]