


- 28-character, multi-time frame powerful panel for a complete market overview
- Customizable buy/sell signal alerts, push notifications, email alerts and a pop-up message on the screen.
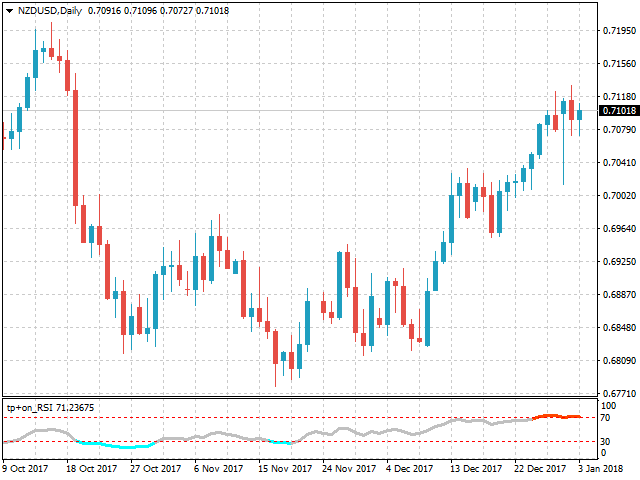
- Marks overbought and oversold levels.
- The three-color RSI indicator marks the neutral state of the market, as well as overbought and oversold states.
The Relative Strength Index (RSI) is an oscillator developed by Welles Wilder and described by him in the famous book “New Concepts of Technical Trading Systems” in 1978.1 He also introduced Parabolic SAR (see Tipu Parabolic SAR Panel), Average True Range and Directional Movement Concept (ADX).
The Tipu Panel series is a set of indicators created to consolidate the values of indicators in the form of a panel. Indicators can easily clutter up the chart and distract you from the bigger picture. It can also be overwhelming and visually draining. Tipu Panel simplifies this by displaying each indicator as a neatly designed panel with cells. You can configure the panel to display indicator signals on multiple timeframes, as well as to quickly switch between timeframes. The Tipu Panel series consists of two types of indicators: the main indicator and plug-in indicators. The main indicator (Tipu Panel) draws a neatly designed panel, and the connected indicators supply data for this panel. The joint work of these two types of indicators provides faster and more efficient work on the chart.
[spoiler title=”Read More…”]
- Uptrends/Downtrends – The RSI can be used to detect a trend. For example, the RSI may remain above the 50 midline in an uptrend (or between 40 and 80).2 You can use the RSI as an addition to the Tipu Trend indicator.
- Top and Buttoms – RSI helps in identifying peaks in the overbought area (usually above 70) and troughs in the oversold area (usually below 30).
- Divergence – divergence occurs when the direction of movement of the RSI is not confirmed by price action. For example, a bullish divergence occurs when the EURUSD updates the minimum, while the RSI minimum is located higher. This means that the EURUSD movement is weakening and a bullish reversal is likely.
- Other applications are fluctuations, support/resistance levels, chart formation.
- A full description of the RSI is available here.
- U is the average value of positive price changes.
- D is the average value of negative price changes.
- Section No. 1 – RSI Settings
- RSI Period – RSI settings.
- Applied Price – RSI settings.
- Overbought – RSI settings.
- Oversold – RSI settings.
- Mark Buy/Sell Signals – mark buy/sell signals, you can choose Arrow (arrows), Vertical Lines (vertical lines) or nothing.
- Arrow offset (pips) – (the parameter works when mark buy/sell signals = Arrow is set) the offset from the price of the maximum (sell signal) and minimum (buy signal) to display the arrow. The higher the parameter value, the further the arrow will be displayed from the maximum/minimum price.
- Buy/Sell Colors – icon colors.
- Section #2 – Panel Settings
- Enable Dashboard? – display the panel, true/false.
- Color settings, the background color of the sell trend, the color of the sell signals, the background color of the buy trend, the color of the buy signals.
- Section #3 – Tipu Panel Settings, Tipu Panel should be added to the graph
- Enable Tipu Panel – display the panel, true/false.
- Short name for Tipu Panel – short name for the title of the Tipu Panel.
- Tipu Panel Display Mode – the display mode of the Tipu Panel: buy/sell signals or a chart of RSI values.
- Section No. 4 – Global settings for Buy/Sell alerts – these settings affect only the Tipu Panel and the Tipu RSI chart. Notifications are managed in the panel using the settings dialog box.
- Alert Entry OB/OS – send an alert when the RSI enters the overbought/oversold area.
- Alert Exit OB/OS – send an alert when the RSI exits the overbought/oversold area.
- Alert Shift – delay of the candle on the signal, enter 1 to send an alert after passing 1 candle.
- Alert Mobile – select true/false to receive push messages, check the device settings here.
- Alert Onscreen – select true/false to receive messages on the terminal screen, displayed in a separate window.
- Alert Email – select true/false to receive email notifications, check the email settings here.
- RSI Period – RSI settings.
- Applied Price – RSI settings.
- Overbought – RSI settings.
- Oversold – RSI settings.
- Mark Buy/Sell Signals – mark buy/sell signals, you can choose Arrow (arrows), Vertical Lines (vertical lines) or nothing.
- Arrow offset (pips) – (the parameter works when mark buy/sell signals = Arrow is set) the offset from the price of the maximum (sell signal) and minimum (buy signal) to display the arrow. The higher the parameter value, the further the arrow will be displayed from the maximum/minimum price.
- Buy/Sell Colors – icon colors.
- Enable Dashboard? – display the panel, true/false.
- Color settings, the background color of the sell trend, the color of the sell signals, the background color of the buy trend, the color of the buy signals.
- Enable Tipu Panel – display the panel, true/false.
- Short name for Tipu Panel – short name for the title of the Tipu Panel.
- Tipu Panel Display Mode – the display mode of the Tipu Panel: buy/sell signals or a chart of RSI values.
- Alert Entry OB/OS – send an alert when the RSI enters the overbought/oversold area.
- Alert Exit OB/OS – send an alert when the RSI exits the overbought/oversold area.
- Alert Shift – delay of the candle on the signal, enter 1 to send an alert after passing 1 candle.
- Alert Mobile – select true/false to receive push messages, check the device settings here.
- Alert Onscreen – select true/false to receive messages on the terminal screen, displayed in a separate window.
- Alert Email – select true/false to receive email notifications, check the email settings here.
1 Wilder J. The parabolic system. New concepts of Technical trading systems, 1978.
2 Cardwell E.Relative Strength Index: Forecasting and Trading Strategies (Relative Strength Index: Forecasting and Trading Strategies), 1999.
[/spoiler]