


For those who have studied the books of Bill Williams “New Dimensions in Stock Trading” and ” Trading Chaos (second edition)” and I tried to trade using these methods, it becomes clear that the standard set of indicators is not enough for full-fledged work. The Trading Chaos Map indicator draws a “market map”, allowing you to see the charts just like the author of the trilogy.
The parameters provide options for enabling and disabling each signal. You can use one or the other method, or use them together. You can independently determine which signals to use, choosing according to your trading style. Also, the indicator tinctures provide you with the ability to independently determine the color scheme of the signal display.
- Colors the bars in certain colors according to the selected method.
- Identifies the signal of the “first sage”, and also highlights the signal amplified by the bar configurations described in the first book “Trading Chaos”.
- Shows the signal of the “second sage” – three consecutive bars of the AO oscillator of the same color.
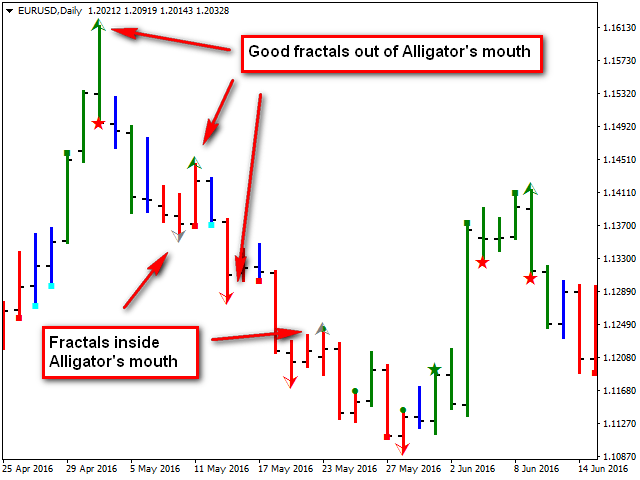
- Draws the signals of the “third sage” – fractals, denoting the valid and invalid signals in different colors.
- Indicates the signals of the oscillator AO “saucer” and “zero line crossing”.
- Shows the signals of the AC oscillator.
- Signals “Special blue light” for AO and AC signals.
- Indicates the addition signals in the Zone.
- Defines the Balance Line signals.
- Shows the signals of the initial stop placement on 5 consecutive bars of the same color.
- Switches the chart display mode to bars, as the candlestick chart becomes visually difficult to read.
- At the user’s choice, it informs about the formation of signals.
[spoiler title=”Read More…”]
- Chart Type – the type of chart display according to the methodologies described in the books
- New Trading Dimensions.
- Trading Chaos 2.
- Drawing bars options-section of options for coloring bars.
- Bar width – the width of the bar.
- Squat bar – the color of the “squat” bar (see the first book of the trilogy).
- Green bar (momentum up) – the color of the bar at which the momentum is directed up (green zone).
- Red bar (momentum down) – the color of the bar at which the momentum is directed down (red zone).
- Gray bar (momentum changes) – the color of the bar at which the momentum changes its direction is not defined (gray zone).
- Divergence bar signal options-section of the parameters of the reversal bar signal. Indicated by a circle. The amplified signal is a star.
- Show signals-enable / disable the calculation and display of signals. This parameter is repeated for each signal.
- Label size – the size of the signal label on the chart. This parameter is also repeated for each signal.
- Color of Buy signal – the color of the buy signal.
- Color of Sell signal – the color of the sell signal.
- AO signal options-section of the signal parameters from the AO oscillator. Denoted by a square.
- Color of Buy signal – the color of the buy signal.
- Color of Sell signal – the color of the sell signal.
- AC signal options-section of the signal parameters from the AC oscillator. Denoted by a diamond.
- Color of Buy signal – the color of the buy signal.
- Color of Sell signal – the color of the sell signal.
- Special Blue Light signals options – section of signal parameters “Special blue light”.
- Color of signal – only one color is used.
- Zone Add signal options-section of the add signal parameters in the Zone. Indicated by an index gesture.
- Color of Stop signal for Long – the color of the buy signal.
- Color of Stop signal for Short – the color of the sell signal.
- Balance Line signal options-section of the Balance Line signal parameters. Denoted by a hollow square.
- Color of signal – only one color is used.
- 5 Consecutive Bars Stop signal options-section of the stop signal parameters for 5 consecutive bars of the same color. Denoted by the number 5 in the circle.
- Color of Buy signal – the color of the buy signal.
- Color of Sell signal – the color of the sell signal.
- Fractal options-section of fractal display options. Displayed with an arrow.
- Color of Good Fractal Up – the color of the actual fractal up.
- Color of Good Fractal Down – the color of the actual fractal down.
- Color of Bad Fractal – the color of the invalid fractal.
- Message options-section of parameters for displaying messages about indicator signals.
- Send Message-enable / disable the output function/sending a message.
- Message Type – the message type. There are three types.
- Terminal Alert – terminal signal.
- Push Notification-notification to the mobile device via the MetaQuotes ID.
- E-mail-sending a message to the email address specified in the terminal settings.
- New Trading Dimensions.
- Trading Chaos 2.
- Bar width – the width of the bar.
- Squat bar – the color of the “squat” bar (see the first book of the trilogy).
- Green bar (momentum up) – the color of the bar at which the momentum is directed up (green zone).
- Red bar (momentum down) – the color of the bar at which the momentum is directed down (red zone).
- Gray bar (momentum changes) – the color of the bar at which the momentum changes its direction is not defined (gray zone).
- Show signals-enable / disable the calculation and display of signals. This parameter is repeated for each signal.
- Label size – the size of the signal label on the chart. This parameter is also repeated for each signal.
- Color of Buy signal – the color of the buy signal.
- Color of Sell signal – the color of the sell signal.
- Color of Buy signal – the color of the buy signal.
- Color of Sell signal – the color of the sell signal.
- Color of Buy signal – the color of the buy signal.
- Color of Sell signal – the color of the sell signal.
- Color of signal – only one color is used.
- Color of Stop signal for Long – the color of the buy signal.
- Color of Stop signal for Short – the color of the sell signal.
- Color of signal – only one color is used.
- Color of Buy signal – the color of the buy signal.
- Color of Sell signal – the color of the sell signal.
- Color of Good Fractal Up – the color of the actual fractal up.
- Color of Good Fractal Down – the color of the actual fractal down.
- Color of Bad Fractal – the color of the invalid fractal.
- Send Message-enable / disable the output function/sending a message.
- Message Type – the message type. There are three types.
- Terminal Alert – terminal signal.
- Push Notification-notification to the mobile device via the MetaQuotes ID.
- E-mail-sending a message to the email address specified in the terminal settings.
By default, the template is used according to the “Trading Chaos (second edition)” method.
It is recommended to use the indicator with the color scheme “Black on White” in the chart properties (F8), together with the standard Bill Williams indicators included in the terminal, as well as the Wawe Viewer indicator.
[/spoiler]