


What happens if you combine the experience of trading in the market and intuition with algorithms implemented in the form of visual maps?
In our opinion, the best strategies are created when traders see what other traders do not see. The concept of these visual maps is to provide a new trading vision and ideas with which you can better see the market and trading strategies.
From quantity to quality: new trading technologies provide more quantitative information each time. But the main idea of this indicator for MetaTrader 5 is the opposite: to create high-quality maps based on forces, using some of the main algorithms of our laboratory, and the great power of quantitative analysis and intuition will do the rest.
From quantity to quality: new trading technologies provide more quantitative information each time. But the main idea of this indicator for MetaTrader 5 is the opposite: to create high-quality maps based on forces, using some of the main algorithms of our laboratory, and the great power of quantitative analysis and intuition will do the rest.
[spoiler title=”Read More…”]
There is no strict scientific theory in the interpretation of the indicator, and you can use it together with other indicators – in any case, the logic of the map algorithm is to color bullish and bearish scenarios on the chart, as opposed to simple indicators that draw lines and/or histograms.
It is very important to determine the best timeframe (in the indicator settings) and the financial instrument that you will trade.
Attention: This is a demo version of the Trajecta SpeedMap productthat only works with NZD pairs.
Attention: This is a demo version of the Trajecta SpeedMap productthat only works with NZD pairs.
Examples of visual information when analyzing trading and supporting decision-making based on this indicator:
- Volatility: large zones can mean more volatility.
- Sideways movement: mixing different colors can mean that there is no trend in the market.
- Trend strength: one color of the indicator can indicate the trend nature of the market.
- Discrepancy: the beginning of a new color can mean a divergence in the market and the beginning of a new trend.
- Risk: be careful with unusual card formats, as they can mean risky situations in the market.
- Cycles: conventional map formats can mean cyclical market scenarios.
- Scenarios: template map formats can mean common market scenarios.
- Correlation: template formats of two-character cards can indicate the possibility of pair trading.
- Combinations: combinations of the colors of the rising and falling trend (new color) can mean a sideways movement of the market or a change of trend to a sideways movement.
- Support and resistance: white areas (colorless) can mean from weak to strong support and resistance zones.
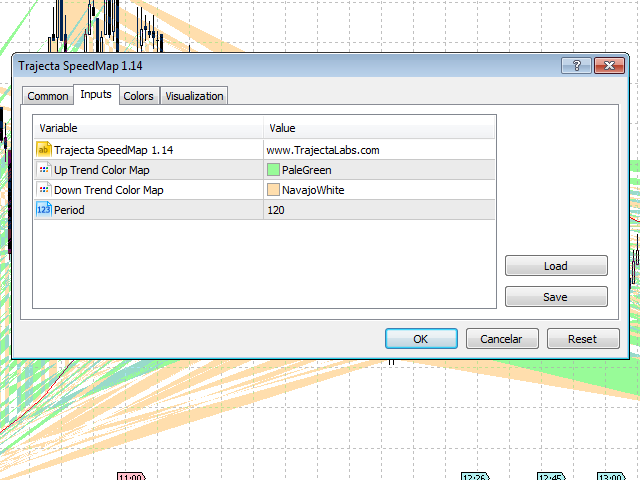
You can use this indicator on any financial instrument and / or timeframe in MetaTrader 5 and create your own input parameter settings:
- Period: the main period of the indicator analysis (default: 120)
- Up Trend Color Map: choose a color for the growing trend maps
- Down Trend Color Map: select a color for the down trend maps
- Period: the main period of the indicator analysis (default: 120)
- Up Trend Color Map: choose a color for the growing trend maps
- Down Trend Color Map: select a color for the down trend maps
This indicator was developed by Rogerio Figurelli, a scientist and researcher of quantitative and algorithmic trading solutions.
Trajecta delivers quantitative and algorithmic trading solutions to global investors, always striving to provide a level of innovation and results that no other quantitative system can provide (Full list of products from Trajecta Labs on the market and in signals).
[/spoiler]