


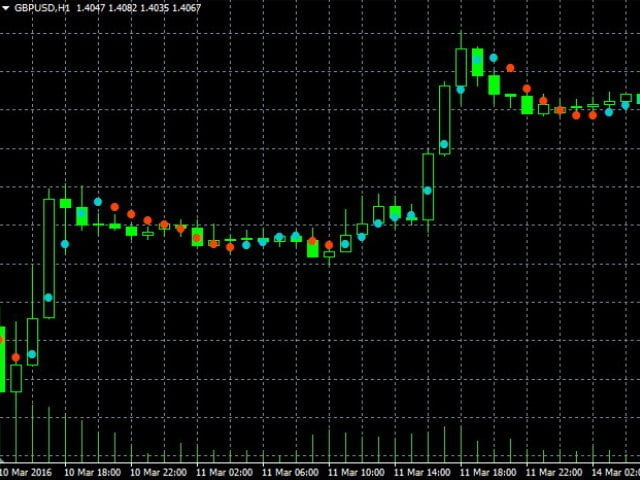

The indicator places points on the chart that show the trend direction of the currency pair.
Bullish (blue) dots give a buy signal. Bearish (red) dots – for sale.
It is recommended to use it together with other indicators. Timeframe from M30 and more.
Simple strategy:
Buy if two blue dots are reflected on the chart.
Sell if two red dots are reflected on the chart.
- Trend points period – The main period of the indicator;
- True range period – Auxiliary period of the indicator;
- Points calculation method – A method for calculating the trend direction (Simple, Exponential …);
- Applied price – The type of price at which the points are located (Open, Close, High…).