


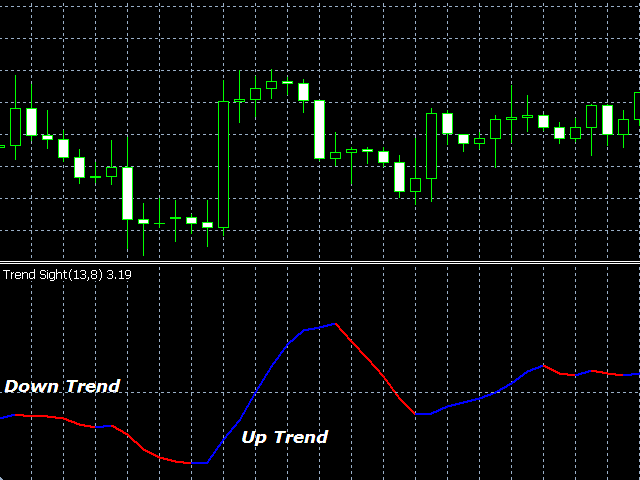

The Trend Sight indicator shows the percentage change in the moving average from the current bar to another selected bar and allows you to track the smoothed rate of price change, as well as the strength of the trend and the trend change.
The uptrend is shown in the blue color of the indicator line, and the downtrend is shown in red.
You can close a short position and open a long one when the line color changes from red to blue.
You can close a long position and open a short one when the line color changes from blue to red.
In this case, you should use a small stop loss, as the line itself can suddenly change color and direction.
The “Inputs” tab of the indicator allows you to select:
- moving average smoothing period;
- moving average smoothing method (Simple, Exponential, Smoothed, Linear weighted);
- applicable price (Close, Open, High, Low, Median, Typical, Weighted);
- the offset of the moving average from the current bar to the other selected bar.
The “Colors” tab of the indicator allows you to select the color, thickness, and style of the indicator line.
- period – the period of the moving average;
- method – smoothing method (Simple, Exponential, Smoothed, Linear weighted);
- applied price – applied price (Close, Open, High, Low, Median, Typical, Weighted);
- shift-the shift of the moving average from the current bar to the bar that is spaced by Shift.
[spoiler title=”Read More…”]
Note: If Shift is less than 1 or greater than Period, a warning will appear: “Shift value error. The indicator will use the value Shift = Period”.
[/spoiler]