


“Trend is a trader’s friend. ” This is one of the most famous proverbs in trading, because the correct definition of the trend can help you earn money. However, it is easier to say about trend trading than to do it, because many indicators are based on price reversals rather than trend analysis. They are not very effective in determining trend periods or in determining whether this trend will continue.
We developed the Trendiness Indexto try to solve this problem. The indicator determines the strength and direction of price trends. An increase in the value indicates a stronger trend, and the color of the bar indicates the direction of the trend (green = up, red = down). The color of the bar darkens when the strength of the trend begins to fade, and turns gray when the trend ends.
The Trendiness Index indicator works well with the productChoppiness Index, they are like two sides of the same coin. Choppiness Index is a non-directional indicator that uses various algorithms to determine the strength of the flatness/trend of the market.
The Trendiness Index indicator works well with the productChoppiness Index, they are like two sides of the same coin. Choppiness Index is a non-directional indicator that uses various algorithms to determine the strength of the flatness/trend of the market.
[spoiler title=”Read More…”]
Short-term:
- Enter the market when the Trendiness Index indicator shows a strong trend and direction (color bar)
- Be careful when the Trendiness Index shows a fading trend (the color of the bar darkens). With a conservative strategy, in this case, you can exit the market, but you can continue to hold the position with the continuing price movement
- Exit the market when the Trendiness Index shows the end of the trend (gray bar)
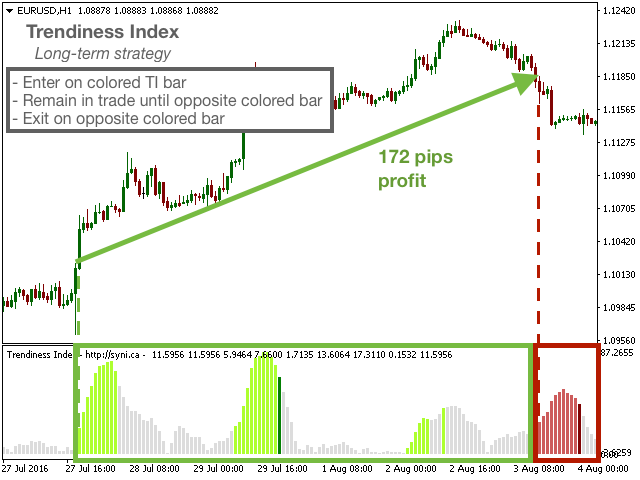
Long-term:
- Enter the market when the Trendiness Index indicator shows a strong trend and direction (color bar)
- Stay in the market until the opposite color bar appears (red – call, green – put), then exit
- You can adjust the sensitivity of the Trendiness Index indicator using the standard deviation and threshold percent parameters
- For optimal results, use the Trendiness Index indicator with trend lines and traditional patterns.
You can set up an email notification, a message, or an audio alert for the following events. Please note that to use email notifications, you need to configure the recipient and SMTP in the settings of MetaTrader 4.
- Trendiness Index shows a strong rising or falling trend
- Trendiness Index shows a weakening trend (depletion)
- Trendiness Index moves from a trending period to a trendless one
- Calculation period (default=14) – the number of bars to calculate the indicator
- Use smoothing – use smoothing
- Calculation period for standard deviation (default=14) – the number of bars to calculate the standard deviation for the trend boundaries
- Standard deviation threshold (default=1.5) – number of standard deviations for determining the trend boundaries
- Calculation period for percentage (default=50) – the number of bars to calculate the percentile to determine the trend
- High percentile threshold (Default=0.75) – percentile of values for determining the trend
- Allow alerts True = alerts enabled, false = disabled
- Alert on beginning of trend-notify when the Trendiness Index indicator shows the beginning of a trend (color bar)
- Alert when trade fades-notify when the Trendiness Index indicator shows trend depletion (the bar darkens)
- Alert when trend over (below trendy threshold) – notification when the trend value is below the border (gray bars, trendless period)
- Turn on alerts message-a message
- Turn on alerts sound – sound alert
- Turn on alerts email-email notification
[/spoiler]