


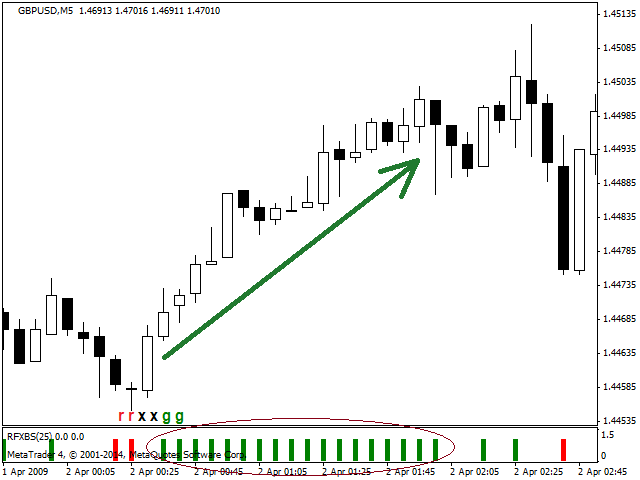

Determining the market trend is an important task for traders. The Trendometer indicator implements an advanced algorithm for visualizing the market trend. The main purpose of the indicator is to evaluate the market on small timeframes (i.e. M1, M5 and M15) for scalping. If you are a scalper and are looking for a reliable indicator to improve the quality of your trading, Trendometer is just what you need. The indicator works in a separate window, showing red and green bars on the histogram. Two consecutive green (red) bars is a good sign for entering the market in a long (short) direction. The number of consecutive bars of the same color indicates the strength of the trend. If there are no one or more bars, the indicator indicates a consolidation in the market.
Custom BUY/SELL signal patterns:
The user can create any number of buy and sell signal patterns to be displayed by the Trendometer indicator. As soon as the indicator finds a pattern, it shows a notification (in the alert window). Two lowercase input parameters are available: Buy Signal Pattern and Sell Signal Pattern. To separate the patterns from each other, use a space. The symbols ‘g’, ‘r’ and ‘x’ indicate a green bar, a red bar, and the absence of a bar in the Trendometer indicator. For example, if you want to be notified when two green bars appear, followed by a red bar, or the bar is missing, specify Sell Signal Pattern = “rgg xgg”.
[spoiler title=”Read More…”]
Specifications:
- Provides reliable buy/sell signals for scalping.
- Constantly follow the trends of changes in market prices.
- Filters out the noise on the candles to reveal the true trend.
- The user can create any number of buy and sell signal patterns, and the indicator will notify you when they appear.
- It works on 4 and 5-digit quotes.
Signals:
- We open a long position (BUY) when two consecutive green bars are formed after the end of consolidation or at the end of a downtrend.
- We open a short position (SELL) when two consecutive red bars are formed after the end of consolidation or at the end of a growing trend.
- Trend Period: a positive integer indicating the period for which the trend is evaluated.
- Min Number of Group Bars: a positive integer indicating the minimum number of bars in the group to filter the trend.
- Max Number of Group Bars: a positive integer indicating the maximum number of bars in the group to filter the trend.
- Show Signal Alarm?: If the value is Yes, the indicator will notify the user about the appearance of buy and sell signal patterns using alerts.
- Draw Signal Arrow?: If the value is Yes, the indicator will draw arrows on the chart when the buy and sell signal patterns appear.
- Buy Signal Pattern: a string where you can specify the patterns of buy signals (the order of specifying the patterns is described above).
- Sell Signal Pattern: a string where you can specify the sell signal patterns (the order of specifying the patterns is described above).
- Sell Color: The color of the sale arrow.
- Buy Color: The color of the purchase arrow.
[/spoiler]