


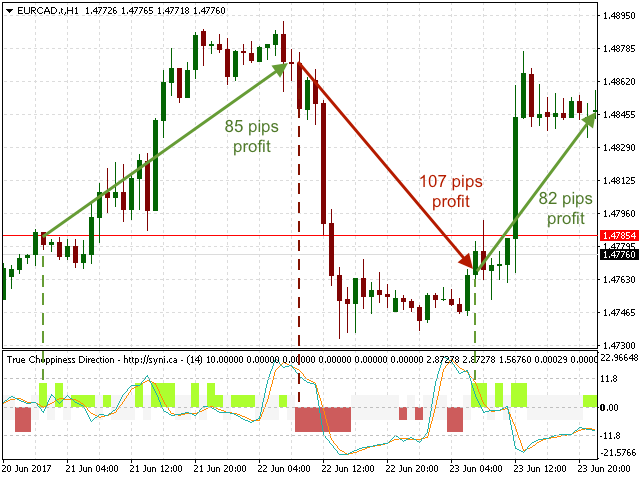

true Choppiness management determines if the market is horizontal or trending, and the direction and strength of the trend (green=upward, red=down, gray=flat). the primary algorithm finds trend movements in spite of “noisy” market data (see screenshots).
The strength of the trend is indicated by a short or long red / green color texture. The Choppiness index is limited to values from -50 (quite expressive) and 50 (very flat). This is a custom algorithm developed by Synapse Investment Research Group Inc.
True Choppiness Direction can be used as part of several trading strategies, either individually or in combination with other indicators. A simple and effective strategy is described below:
- TCD Calculation Type (default Standard): The indicator visualization method is Standard (with flat lines), TCDBars (with flat bars), or Histogram (fast trend/flat detection, trend < 0, flat > 0).
- Calculation period (default 14): The number of bars to calculate.
- Control line period (default 5): The calculation period for comparing short-and long-term flat/trend values. This parameter changes the sensitivity to flat/trend periods.
- Control scaler (default 1.25): Counter for short-and long-term flat/trend values.