


A must-have tool for any strategy based on divergence detection. 10 different oscillators can be used to find divergences, as well as combine them with the “Double Bottom” and “Double Top” patterns to confirm the signals for a reversal.
THE SCANNER is turned on. Now with Scanner, you can easily and quickly find trading opportunities and settings.
- Easily detects strong reversal signals
- 10 different oscillators are available to detect divergences
- Detection of divergences and patterns of “Double bottom” and “Double top” can work independently of each other or in combination
- Sending email messages and push notifications when a divergence is detected
- The indicator does not redraw
- You can use it as part of an Expert Advisor (see the sectionFor developers)
- Name: the name shown in parentheses in the upper-left corner of the oscillator window.
- ENABLE Double Top-Bottom: Enable the “Double Bottom” and “Double Top”pattern indicator.
- Select Divergence Oscillator: Select one of the available divergence indicators or disable divergence detection
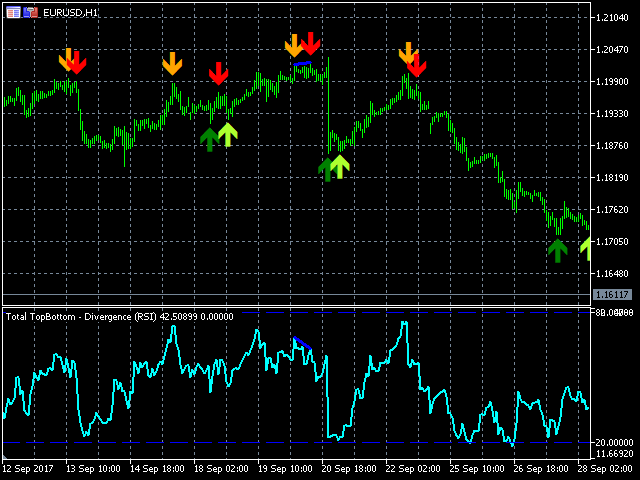
- Relationship between Double Top-Bottom and RSI Divergence-The relationship between the Reversal Pattern and the Divergence of the RSI:
- Sharing:All signals of the “Double Bottom” and “Double Top” patterns are shown, but the RSI divergence signals are only shown if they match the “Double Bottom” and “Double Top” patterns. The “Double Bottom” and “Double Top” patterns and the RSI divergence indicator should be enabled.
- Private use:the signals of the indicators are displayed independently from each other
- Number of Bars (odd number) [divergence only]: on this number of bars, the maximum or minimum will be determined, including the upper / lower bar. For example, if the value is 5, the maximum prices will be determined on bars whose maximum is higher than the maximum of the next two bars on the left and right. If the RSI Divergence indicator is used independently, it uses this mechanism to determine the highs and lows. Otherwise, the highs and lows are determined using the “Double Bottom” and “Double Top”indicator.
[spoiler title=”Read More…”]
- Sharing:All signals of the “Double Bottom” and “Double Top” patterns are shown, but the RSI divergence signals are only shown if they match the “Double Bottom” and “Double Top” patterns. The “Double Bottom” and “Double Top” patterns and the RSI divergence indicator should be enabled.
- Private use:the signals of the indicators are displayed independently from each other
The following parameters are divided into groups related to each of the available oscillators. Only the parameters that relate to the indicator selected in the Select Divergence Oscillator field should be adjusted.
- RSI Period – the RSI period
- RSI Applied Price – the price of the bar used to calculate the RSI.
- CCI Period – CCI period
- CCI Applied Price – the price of the bar used to calculate the CCI
- CHO Fast Period – period of the fast line CHO
- CHO Slow Period – the period of the slow CHO line
- CHO Method – CHO calculation method
- CHO Applied Volume – the volume for calculating CHO. (Use real volumes if available, for example, for stocks. If real volumes are not available, for example, in the Forex market, use tick volumes.)
- CMO Period – the period CMO
- MACD Fast Period – the period of the fast line of the MACD
- MACD Slow Period – the period of the slow MACD line
- MACD Signal Period – the period of the MACD signal line
- MACD Applied Price – the price of the bar used to calculate the MACD
- Momentum Period – the Momentum period
- Momentum Applied Price – the price of the bar used to calculate Momentum
- Stochastic %K Period – the period for calculating the %K line of the Stochastic oscillator
- Stochastic %D Period – the period for calculating the %D line of the Stochastic oscillator
- Stochastic Slowing-the degree of internal smoothness of the line %K
- Stochastic Method – method for calculating the %D line
- Stochastic Price Field – the volume for calculating the Stochastic oscillator. (As a rule, Real is used for stocks, Tick for Forex.)
- Stochastic RSI period – the RSI period
- Stochastic RSI %K Period – the period for calculating the %K line of the Stochastic oscillator
- Stochastic RSI %D Period – the period for calculating the %D line of the Stochastic oscillator
- RVI Period – the RVI period
- ROC Period – the ROC period
- ENABLE Alert / Email Alert / Push Notifications
[/spoiler]