


This indicator draws:
TX – The max price since the last cross down, between M20 and M200, and the previous up cross
BX – The min price since the last up crossover, between M20 and M200, and the previous down crossover
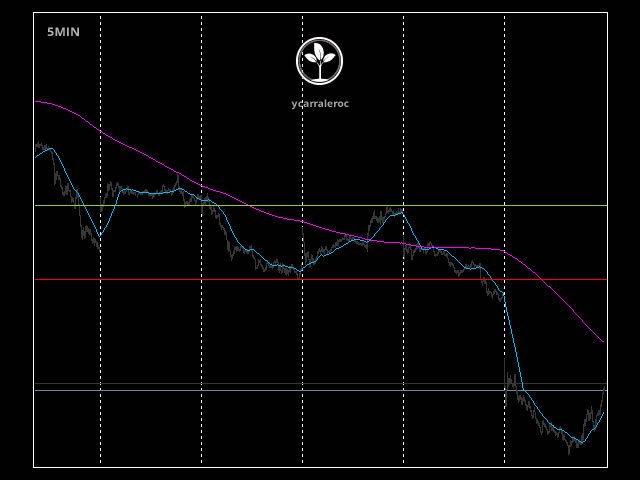
You will need to use the A5_D template that shows
1. Simple Moving Average 20
2. Simple Moving Average 200
3. Period Separators
4. ASK line
Support
I will be happy to hear your recommendations to improve this product.
Author
Yuniesky Carralero Cuellar, Computer Scientist