


This is a simple but very powerful indicator
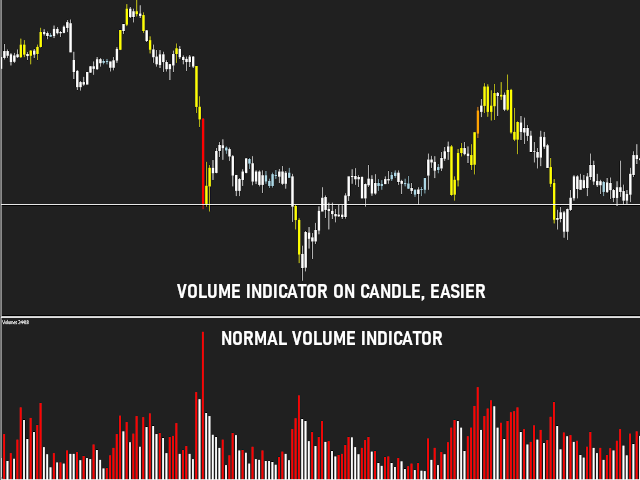
His objective is check the market volume in an easier way, just looking at the candle
For calculate the volume in each candle, the indicator considers the volume in a period (understand the period as a certain amount of candles)
Example: In a period of 20 (20 bars) candles closed with a volume of 1000, if the last bar closes a smaller volume, close to the average, higher or much higher, the indicator will show this variation through a color
With this indicator is possible do some readings, like:
- Identify with volume the levels that have occurred price absorption/rejection
- The volume when a breakdown occurs in support, resistance or price consolidation zone
- Check the strength of a trend. See if volume levels are high when the price goes up or down
The user has access to the following settings:
- Period
1 – 120 (default: 60)
Values outside the range are not considered
- Volume Type
Real Volume – Tick Volume (default: Real Volume)
- Volume Weight
Very low -> Normal -> Medium High -> High -> Very High
Each color represents a volume level, respectively in the order above