


Volume levels are a very important indicator for stock trading. It was at these levels that the most transactions were made. This indicator shows at what price there were the most trading volumes for a certain period of time. Often, the price bounces off such levels in the future, and this can be successfully applied in trading. It works on any currency pairs.
- HistoryBars – the number of bars used to determine the nearest volume levels;
- Range – the maximum distance above and below the current price to determine the levels;
- HistoryBarsLevels2 – number of bars for determining the far volume levels;
- MinDistanceLevels2 – minimum distance from near level to far level;
- RedrawTime – time for redrawing levels;
- Step – the step of determining levels (the smaller the step, the higher the accuracy, but the calculation of levels can take longer);
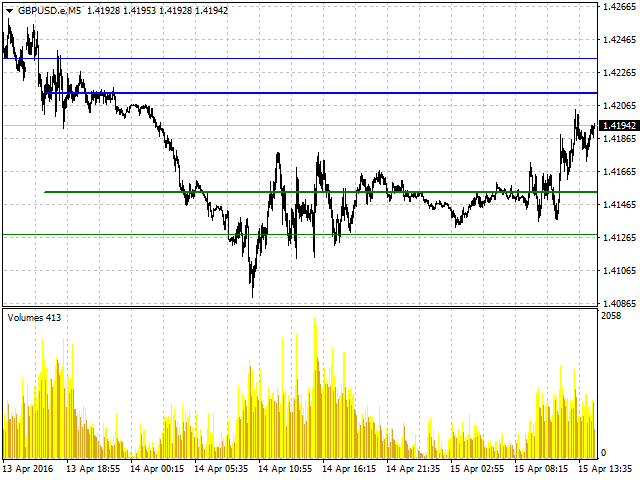
- ColorLow – color of the lower levels;
- ColorHigh – the color of the upper levels.
The smaller the timeframe, and the larger the HistoryBars parameter, the stronger the levels will be. When used on a 5-digit account, it is better to increase the Range and MinDistanceLevels2 parameters by 5-10 times. The indicator is best used on small timeframes (M1, M5, M15, M30), but it can also be used on larger ones.