


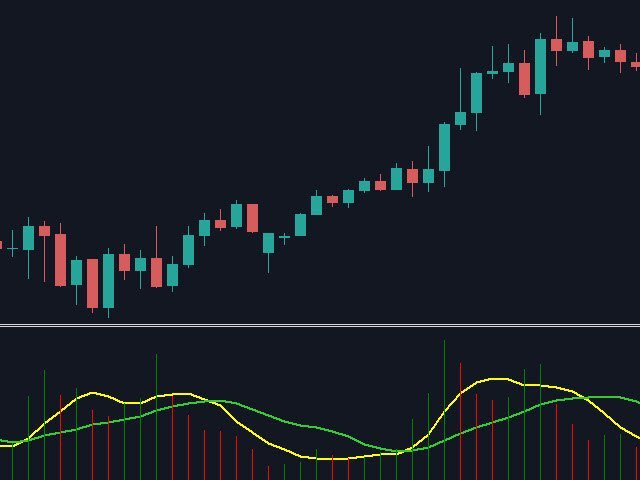

This indicator will show the the change of volumes via 2 lines of SMA:
. Fast line (default is 5 candles)
. Slow line (default is 13 candles)
We can use the crossing point of fast line and slow line to know investors are interesting in current price or not.
Pay attention:
The crossing point is not signal for entry.
Absolutely that we must use in combination with other indicators for sure.
Parameters:
. Fast line periods: the periods (candles) to calculate SMA of fast line
. Slow line periods: the periods (candles) to calculate SMA of slow line
. Shift: draw line at a shift on chart.
. Show volumes histogram: true/false