


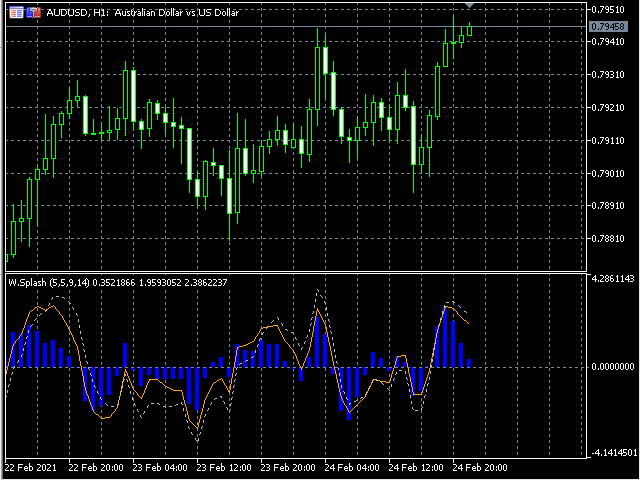

The Wave Splash technical indicator measures the deviation of the instrument price from the average values for a certain period of time. It forms models of divergence from the price chart and generates leading signals that make it possible to timely detect signs of an upcoming correction in the price of the instrument or a reversal with a trend change even at the time of updating the price of extreme values. The Wave Splash indicator is effective in an active market and shows a good risk-profit ratio at the entry points.
Settings:
Sensitivity, range from 0 to 100.
Hint = 5. (bar chart)
Splash Line = 9. (solid line)
Influence Line = 14. (dotted line)
Applied price = Close.
Signals:
* divergence / convergence — when the indicator line forms extremes in the direction opposite to the price movement;
* crossing the zero level line-indicates a change in the trend, if above” 0 “is a bullish trend, if below” 0 ” is a bearish trend;
* identification of overbought/oversold zones – the higher the peak or trough on the indicator chart, the higher the probability that the instrument is overbought or oversold ;
* perfectly shows any short-term price movements that scalpers are interested in;
In addition to the signal function of the indicator, it is obvious to use Wave Splash as a filter when it is necessary to focus on short-and medium-term trends when conducting technical analysis.
[spoiler title=”Read More…”]
[/spoiler]