


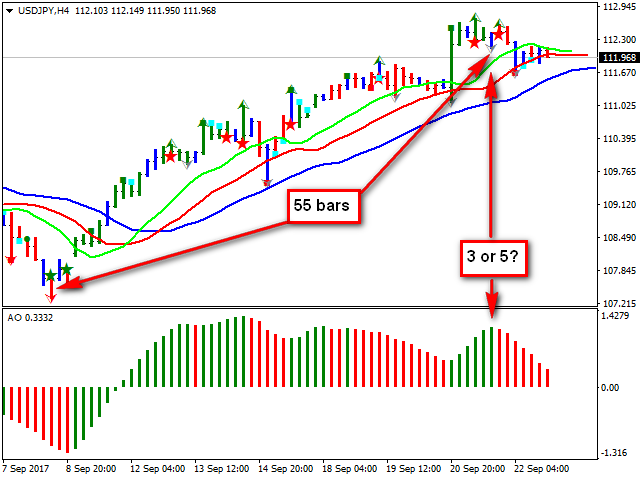

According to the method of Bill Williams from the “Trading Chaos” series, for an accurate calculation of Elliott waves using the Awesome Oscillator indicator, the wave under study should be 100-140 bars. Calculating the required period is quite time-consuming, and a standard set of timeframes is not always enough for this. The Wave Viewer indicator automatically calculates the period to get the correct number of bars and opens the wave for analysis in a new window. The indicator will be useful to all traders without exception who trade on the basis of Elliott waves.
Wave Viewer:
- It is easy to use, it is easy to work with, you save time and effort.
- It draws a graph of any period from M1 and above, allowing you to deploy the wave under study most accurately, so that you can make the right decisions.
- Marks the beginning of the selected range with a vertical line, which makes viewing more convenient, it is easier for you to analyze the market.
- Applies the template you created to the graph, displays the graph as it is convenient for you, you see the usual image with all the details.
This is not really an indicator. This is a utility. The essence of this utility is not to count waves, but to expand the wave in question at the scale necessary for the correct independent calculation of waves by the user, even if there is no such scale in the terminal.
[spoiler title=”Read More…”]
- Name of template – the name of the template that is applied to the chart opened by the indicator. By default, Wave Viewer template.
- Start mark color – the color of the start mark indicating the beginning of the range under consideration.
For correct operation, a sufficient amount of data for smaller periods must be loaded. If there is not enough data, the indicator will record this in the Expert Log.
A Rectangle is used to select the range. For ease of use, it is recommended to apply the following. Open the “Settings” of the terminal, select the “Objects”, in the “fieldSelect an object after creation” check the box. Now the rectangle you created will be selected automatically, and to delete it, just press the “Delete” key.
It is recommended to use the Wave Viewer indicator in conjunction with the Trading Chaos Map and the standard Alligator and Awesome Oscillator indicators.
[/spoiler]