


The Weekly Pivots indicator calculates and displays weekly pivot levels on the MT4 chart. The indicator allows you to configure the calculation window in such a way as to synchronize the pivots with the market in which the trader is trading. For example, for trading at the opening of the London or American session, you can set up the calculation of the system, and the pivot levels will be the same as for most market participants.
All FX AlgoTrader pivot systems use hourly data to calculate levels. This means that the calculations can be set up by the hour. This also means that you can create accurate pivot levels, almost point-to-point, similar to the published levels from leading companies, such as Mataf.
- Shift for Calculation Start Time – the positive or negative number of hours to shift the start of calculations.
- Shift for Calculation End Time – the positive or negative number of hours to shift the end of calculations.
- Enable Alert on WR3-WS3 (13 levels) – alert, when set to true, the system monitors the price behavior and notifies the trader when approaching the active pivot levels at the distance specified in the Pivot Trigger Threshold parameter.
- Pivot Trigger Threshold-the channel around the pivot levels where the alert is triggered, the distance is specified in points.
- Send Email Alerts-enable / disable sending email notifications.
- Alert Sound The audio file in wav format should be located in the MT4 sounds folder.
- Max number of Alerts – the maximum number of alerts in the current alert cycle.
- Show Intermediate ‘M’ Levels-displays the M levels.
- WR3-WS3 Color – the color of the pivot levels.
- Line Style – the style of lines for pivot levels: solid, dotted, dashed.
- Ray-continuation of the pivot level in the form of a ray “into the future”.
- Pivot Label Shift (periods) shift the pivot level by X periods to the right or left, positive or negative value.
- M1-MN1 Line Lengths – the line length for each timeframe.
- Show Pivot Calculation Data Window-show / hide the data calculation window on the chart.
- Calculation Data X Position – the x coordinate for the window location.
- Calculation Data Y Position – the y coordinate for the window location.
- Calculation Data Color – the color for displaying the data.
- Calc Data Font Size – the font size for displaying the data.
- Vis_M1_Chart-Vis_MN1_Chart-enable visibility of pivot levels on timeframes.
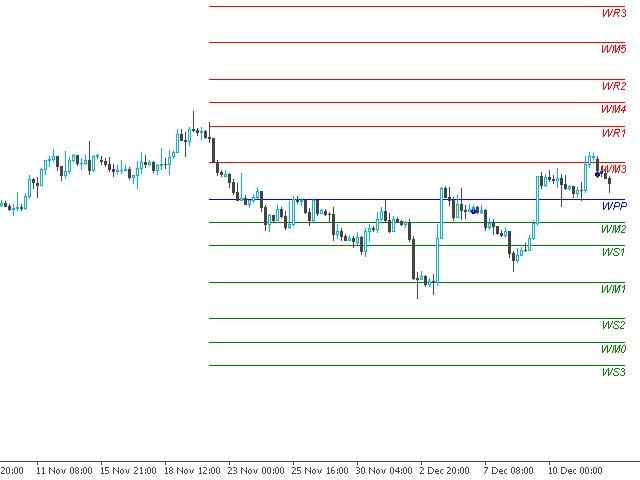
- Show Calculation Points – if true, the start and end points of the calculation window will be displayed as points on the graph.
- Calculation Point Color – the color of the points.
- Show Previous Weeks ‘ High/Low – display the high and low of the previous week.
- Previous Week’s High/Low Color – the color of the previous week’s high and low.
- Last Week’s High Text – text at the level of the previous week’s high.
- Last Week’s Low Text – the text at the level of the minimum for the previous week.