


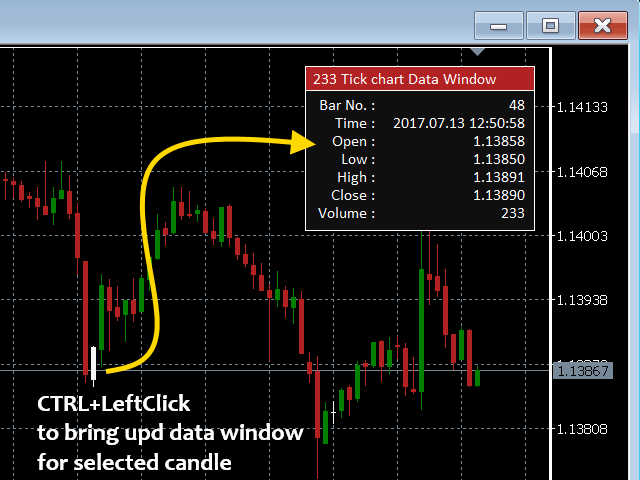

Tick charts show the number of trades on each bar. For example, if there are 233 ticks on your chart, 233 trades correspond to each bar. After 233 trades, a new bar is drawn.
You can choose any number of ticks per bar, but most traders choose Fibonacci numbers(1, 2, 3, 5, 8, 13, 21, 34, 55, 89, 144, 233…).
The indicator uses tick data for tuning, and real ticks for plotting the current chart. This calculation method allows you to create very accurate graphs without approximation.
- Ticks per bar-pixels per bar
- Show history for number of days-display the specified number of days (plus the current one) for the analyzed history volume
- Synchronize first bar’s open on a new day-synchronize the opening time of the first bar on a new day (true/false)
- Use padding Top/Bottom (0.0 – 1.0) – upper and lower bounds above and below the visible high and low of the tick chart
- Show pivot levels – Show Monthly, Weekly and Daily pivot levels
plus Daily R1, R2, R3