


This indicator displays the wave
structure of the market in the form of several wave levels nested in each other. For each of these levels, an automatic
preliminary (rough) wave layout is created in the Elliott style (123…, ABC…, etc.). This markup is
fully automatic and absolutely unambiguous. The indicator is especially useful for novice wave analysts, because among
all the possible options for wave marking, it allows you to immediately take as a basis the most adequate option, which in the future requires
only some (usually small) clarifications. For experienced wave analysts, this indicator will also be interesting, since it
allows you to compare its readings with their own vision of the market wave situation.
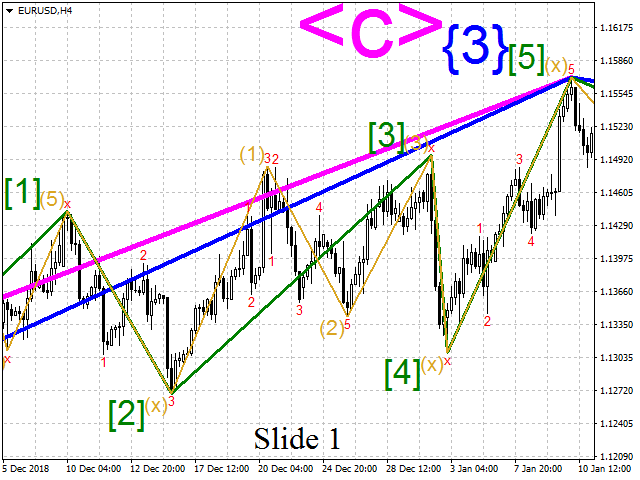
The overall appearance of the indicator is
shown in slides 1 and 2. In total, the indicator can display from one to four wave levels on the screen. Each of these
levels has its own designation: from W1 (for the youngest) to W4 (for the oldest). Each level is displayed in its own color in the form of
lines and / or markings.
The lowest wave level W1
it is based on the zero level, which is denoted as W0. The Mono indicator is used as the zero wave level
Waves, which is not included in the Multi indicator
Waves, but if you want, you can download it for free in the Market.
Please note: the Multi Waves indicator for the
wave level W0 only marks its waves (shown on the slide 1 in red), and does not draw its wave line
. If you still need to draw this line, then you should download the Mono indicator
Waves (via the free link above) and set it on the chart together with
the Multi Waves indicator (and with the same
parameter values as Multi Waves).
[spoiler title=”Read More…”]
Each subsequent (more senior)
wave level is constructed on the basis of the previous (more junior) wave level according to the method given below (see the section entitled
“Z-like and T‑like structures”). For example, the W2 level
it is based on the wave level W1.
Parameters
The indicator has the following main
parameters:
- Base Mono W0
line: Channel Width
in Points – zero
wave level: channel width in points; - Base Mono W0
line: Channel Width
in Percent – zero
wave level: channel width as a percentage; - Draw MultiWave lines –
how many wave levels to display; - Show W0 labels –
show (or not) the wave marking for the zero wave level; - Show W1 –
what to show for the first wave level: only its line, or only its marking, or both, or show nothing; - Show W2 –
similarly, what to show for the second wave level; - Show W3 –
same for the third level; - Show W4 – the
same for the fourth.
The first two parameters are intended for setting the zero (base) wave level.
Since the Mono Waves indicator
(which is referenced above) is used as this zero level, these two parameters are essentially settings for this indicator.
In addition to these parameters, there are other
parameters: to select the color, as well as the thickness and style of the lines for each of the wave levels W1 – W4.
Z-like and T‑like
structures
In order to understand the principle of operation of
this indicator, it is necessary first of all to recall one of the classical definitions of the trend. For an uptrend: “Every next peak
above the previous peak, and each subsequent bottom is also higher than the previous bottom” (see slide 3a). For a downtrend, this definition is the
opposite: “Every next peak is lower than the previous peak, and every next bottom is also lower than the previous bottom” (see
slide 3b).
And if you slightly change the first of
these definitions, for example, in this way: “Every next peak is higher than the previous peak, and every next bottom is lower (not higher) than the
previous bottom.” What happens then? This will be some expanding formation (see slide 3c). This
figure undoubtedly refers to one of the variants of the sideways trend (i.e., it does not refer to either an uptrend or a downtrend).
Now let’s change a little …
(see the continuation of the description on the “Discussion” tab).
[/spoiler]