


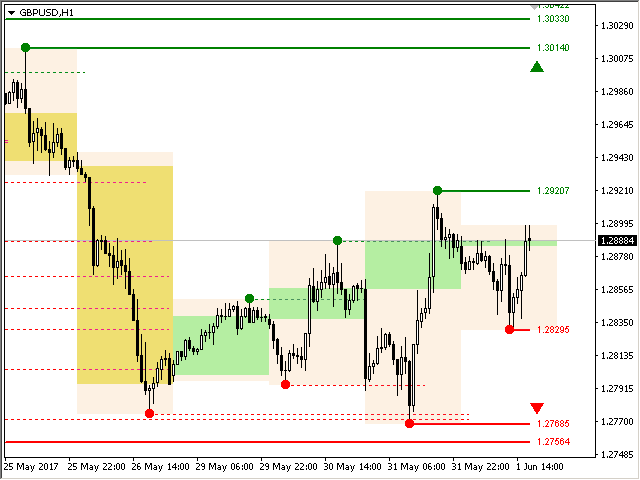

Multi-time frame ZigZag indicator. Displays the support/resistance lines and their breakout, as well as draws the current market goals. You can also
display the lines of the Fractals indicator, and candlesticks from other timeframes (up to and including the Quarter).
The indicator redraws the last (current) point, and in some cases can change the last 2-3 points.
This version is only for MT4.
This version is only for MT4.
All lines are drawn by objects (not indicator buffers, but it is possible to get data for EA).
When
used in the Expert Advisor, you can read the zigzag points using iCustom. To do this, specify the number of points in the very
first parameter.The current (last) point will have an index of 0, the previous one will have an index of 1, etc.
For example :
- Mode-draw support and resistance levels by:
- ZigZag-the ZigZag indicator;
- ZigZag Close — closing candlesticks;
- Fractals-the Fractals indicator;
- High-Low of the period — plotting the indicator based on high-low levels. The timeframe is specified in
in the Period parameter; - Candles only-draw only Candles;
- Depth — the minimum of candlesticks on which the ZigZag indicator will not build a second maximum (or minimum) if it is less than (or
more) on the Deviation of the previous one respectively; - Deviation — the minimum number of points between the highs/lows of two adjacent candlesticks, in order for the indicator to
ZigZag formed a local vertex / trough; - Backstep — minimum number of candlesticks between local highs/lows;
- Period — the period for calculating the Zigzag or Fractals;
- Max bars to calculate (bars) — the maximum number of bars to calculate. This restriction is made to speed up
calculations; - Show Zigzag — show ZigZag;
- Show current ZZ-point — redrawing point) – show the current (last) point;
- Show Price — show the price of the levels;
- Show Targets — show current goals (where the market is aiming for);
- Show broken lines — show broken levels;
- Extend broken lines — bars) – extend broken lines to the right for a specified number of bars;
- Show Dot at the start of the line — show points on the indicator breaks;
- Pop up alerts — a pop-up message when you touch a level;
- Push notifications — Push notification;
- E-mail notifications-notification by e-mail;
- Sound alert — sound alert when you touch a level;
- Alert when “Line breakout” – alert when the zigzag level is broken;
- Alert when “Changing the ZigZag direction” – alert when the zigzag direction changes;
- Alert when “Price is near the line” – alert if the price is near the level (once per bar, the current zigzag point is not
checked); - Distance to the line for alert (points) — distance for the alert (in points);
- Upper line color — the color of the upper lines;
- Lower line color — the color of the lower lines;
- Main line width — the thickness of the main line;
- Main line style — the style of the main line;
- Used line width — the thickness of the used line;
- Used line style — the style of the used line;
- Font size price — font size for Prices;
- Font size dot — font size for Dots;
- ZigZag color — the color of the zigzag;
- ZigZag width — the thickness of the ZIGZAG lines;
- ZigZag style — the style of the ZIGZAG lines;
- Display candles-enable the display of candles from other periods;
- Candles period — the period for candles, all standard plus a Quarter;
- Number of Candles in the past — the number of candles on the chart;
- Shadow color — the color of the candle shadow;
- Body color (bullish) – bullish candle body color;
- Body color (bearish) — the body color of a bearish candle;
- Save points to global variables-save points to Global Variables of the terminal;
- Number of points to be stored — the number of points to be stored (the current point is zero);
- Prefix global variables-prefix for the names of Global Variables.
[spoiler title=”Read More…”]
- ZigZag-the ZigZag indicator;
- ZigZag Close — closing candlesticks;
- Fractals-the Fractals indicator;
- High-Low of the period — plotting the indicator based on high-low levels. The timeframe is specified in
in the Period parameter; - Candles only-draw only Candles;
[/spoiler]