


The z-score of returns and price indicator (ZRP) shows the z-score of the log returns which were assumed to follow a normal distribution and the z-score of the price.
Returns are mean reverting and assumed to follow a normal distribution, therefore z-score calculation of returns is more reliable than z-score on price, as price is NOT mean reverting and follow NOT a normal distribution but a log-normal distribution.
Z-score measures the distance to the mean in terms of standard deviation. If z-score is 0 it is equivalent to the mean score, if it is 1.0 the distance is 1 standard deviation from the mean. Therefore, it is important that the underlaying data follows a normal distribution, which the returns are assumed.
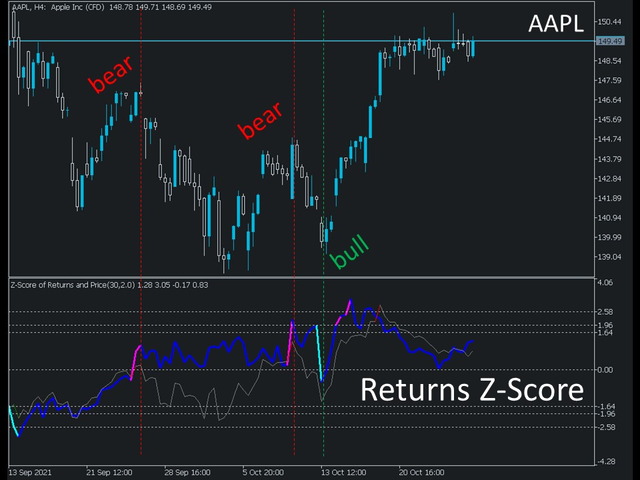
Main indicator data is the thick z-score line of the returns (coloured blue). It also shows outliers, if the respective line exceeds it individual standard deviation band it changes colour. At the default mode is exceeding 2 SDs. If turning pink it indicates a pre-warning that a bearish reversal could take place. If the Blue line turns “aqua” it indicates a bullish reversal.
Second thin grey line is the zscore of price. As previously described, price is not normal distributed, so it must be handled with care. Red and green colouring of that curve are showing possible reversals.
How to trade: As the returns are mean reverting, it is more likely if the z-score is high, that there will be a reversal back to the mean. So, it is an oscillator in a general sense. The confidence intervals for 90%, 95% and 99%, are also plotted which can act as probability levels, that the z-score will not exceed that level. That means, it can indicate a reversal. For instances if the curve is close to the 99% line, there is only a probability of 1% that the z-score of returns will exceed that line, so a reversal is more likely. Also, the colour change of the returns line (default: blue) can indicate a reversal (pink: bearish, aqua: bullish)
The Input Settings:
Sample Size: Default 30, length of periods back to calculated z-score of log returns and price
Multiplier: default 2.0, Multiplier in terms of standard deviation, to show outliers/possible reversals (line colour change)
[spoiler title=”Read More…”]
The z-score of returns and price indicator (ZRP) shows the z-score of the log returns which were assumed to follow a normal distribution and the z-score of the price.
Returns are mean reverting and assumed to follow a normal distribution, therefore z-score calculation of returns is more reliable than z-score on price, as price is NOT mean reverting and follow NOT a normal distribution but a log-normal distribution.
Z-score measures the distance to the mean in terms of standard deviation. If z-score is 0 it is equivalent to the mean score, if it is 1.0 the distance is 1 standard deviation from the mean. Therefore, it is important that the underlaying data follows a normal distribution, which the returns are assumed.
Main indicator data is the thick z-score line of the returns (coloured blue). It also shows outliers, if the respective line exceeds it individual standard deviation band it changes colour. At the default mode is exceeding 2 SDs. If turning pink it indicates a pre-warning that a bearish reversal could take place. If the Blue line turns “aqua” it indicates a bullish reversal.
Second thin grey line is the zscore of price. As previously described, price is not normal distributed, so it must be handled with care. Red and green colouring of that curve are showing possible reversals.
How to trade: As the returns are mean reverting, it is more likely if the z-score is high, that there will be a reversal back to the mean. So, it is an oscillator in a general sense. The confidence intervals for 90%, 95% and 99%, are also plotted which can act as probability levels, that the z-score will not exceed that level. That means, it can indicate a reversal. For instances if the curve is close to the 99% line, there is only a probability of 1% that the z-score of returns will exceed that line, so a reversal is more likely. Also, the colour change of the returns line (default: blue) can indicate a reversal (pink: bearish, aqua: bullish)
The Input Settings:
Sample Size: Default 30, length of periods back to calculated z-score of log returns and price
Multiplier: default 2.0, Multiplier in terms of standard deviation, to show outliers/possible reversals (line colour change)
[/spoiler]