


Support and resistance are important price levels in the intraday market. These levels are usually tested by the price, after which it continues to move, or lead to a trend reversal. For experienced traders, the exact definition of support/resistance levels is difficult to overestimate. Many popular trading strategies are based on them (for example, breakout/rebound trading). Precision Support and Resistance is designed for professional traders. In addition to accurately determining support/resistance levels, the indicator has a number of additional features: the detection of candlesticks for decision-making, internal candlesticks for calculating probability, Pivot analysis and Ladder strategy. Each of these tools can be turned on/off.
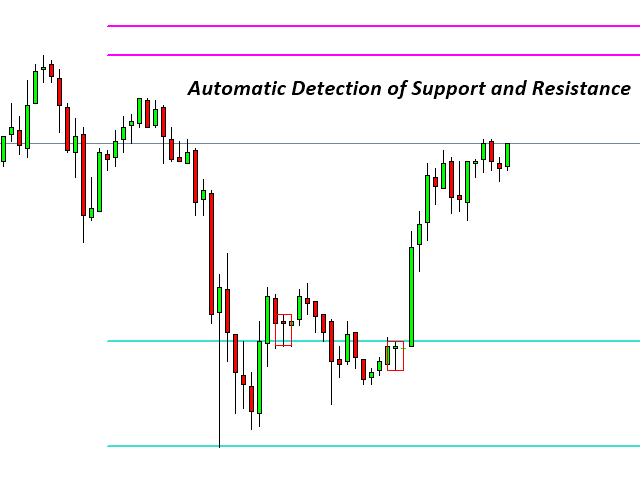
1. Support and resistance
Density and geometry are used to calculate support/resistance levels. The accuracy of determining the levels depends on the strength of the breakout or rebound.
2. Candle recognition for decision making
The candle recognition module notifies the trader about a possible strong movement. A key candle usually appears before a strong reversal or a strong continuation of the current trend. You need to be especially careful if the price is at an important support/resistance level.
[spoiler title=”Read More…”]
3. Calculation of internal candlesticks (Intra)
Intra candlesticks-statistical prediction of future ranges of the closing price within the predicted future. Levels are displayed 1%, 5%, 10%, 32%, 50%, 80%. The indicator draws a pair of lines above and below the opening price of the current candle. A 50% probability means that the chance of closing the price outside the bar is 50% of the opening price of the candle. You can accurately estimate when the price will touch the support/resistance level, moving average, Bollinger band, etc.
4. Pivot analysis)
The indicator uses standard methods for analyzing reversals. U-turn analysis is used for two purposes. First, the reversal levels can be used to double confirm the support and resistance levels. Secondly, they can be used to confirm approximate trends. For example, if the price closed yesterday between S1 and S2, then you can judge the falling trend. The built-in U-turn analysis reveals only daily U-turns, and you can select the number of required days to display them.
5. Ladder Strategy)
The ladder strategy answers the question of what is the probability that the price will close behind a certain level. For example, you think that the 1.2400 level is important, and you want to find out what is the chance that the price will close above this important level. Use the ladder strategy to calculate the probability.
Customization
The default settings are suitable for most symbols and timeframes. It is recommended to use them. The process of changing the parameters is extremely simple and does not need any explanations.
Using
You can use Precision Support Resistance as a self-sufficient tool to trade for a breakout or rebound. The indicator can be used on any timeframe with different performance levels. You can also use the products listed below, but only after mastering Precision Support Resistance.
- Harmonic Pattern Plus MT4
- Harmonic Pattern Scenario Planner MT4
- Price breakout Pattern Scanner MT4
- Sideways Market Statistical Analyzer MT4
- Fundamental Trade Manager MT4
[/spoiler]