


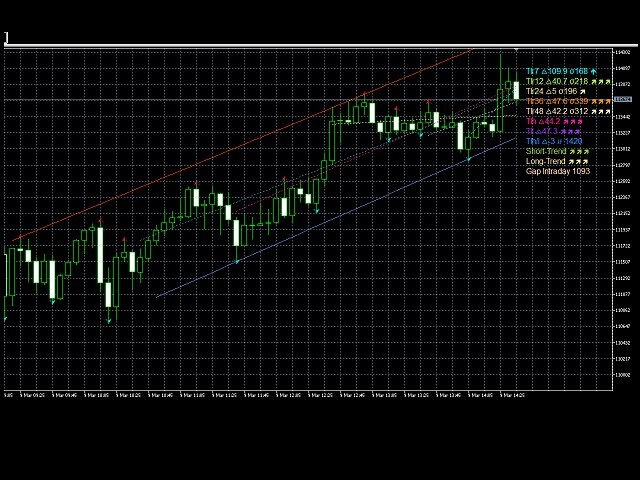

This indicator shows the TLH and TLL and some trendlines that allow us to estimate the trend of market.
It also shows the values of the angles of the lines in points, the standard deviation, and the trend of each line, and when it breaks the lines of support and resistance (TLH and TLL).
And finally, it also shows the points identified as supports and resistances through the fractal algorithm in the graph.