


In order to make the standard indicators adaptive, this version uses the concept described by John Ehlers in his book “Rocket Trading”. This indicator uses a homodyne discriminator to calculate the dominant cycle. For the application of the homodyne discriminator, the real and imaginary parts of the common-mode and quadrature components are calculated (the common-mode and quadrature components are derived using the Hilbert transform. You can read more about this in the article “Advanced adaptive Indicators: theory and implementation”, in particular, in the section on complex numbers and phasors for calculating market cycles and measuring the cycle period).
[spoiler title=”Read More…”]
To get the real part, the product of the current value of the common-mode component and its value on the previous bar is summed with the product of the current value of the quadrature component and its value on the previous bar. To obtain the imaginary part, the product of the current value of the quadrature component and the value of the common-mode component on the previous bar is subtracted from the product of the current value of the common-mode component and the value of the quadrature component on the previous bar. Before calculating the cycle, the real and imaginary parts are smoothed out.
The cycle is calculated as the arctangent of the imaginary part divided by the real one. Restrictions are imposed so that the frequency of cycle changes is limited to a value of -50% of the previous cycle. In addition, the resulting loop is limited by the condition that its value must be greater than 6 and less than 50. The smoothing is then applied to the last value of the cycle time.
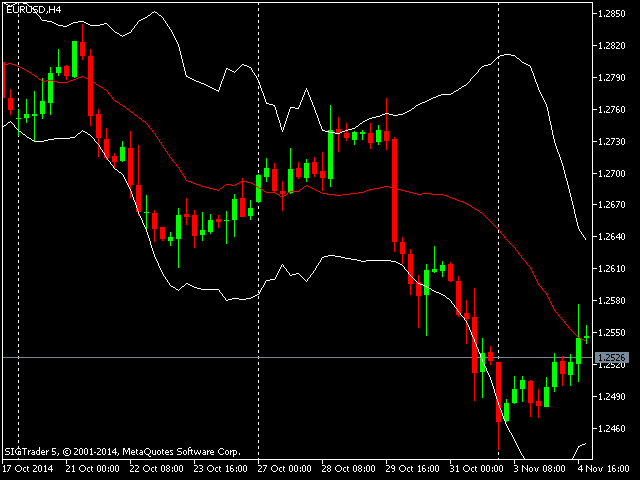
The cycle value is used at each closing of the bar as a value representing the number of previous bars needed to build the “Bollinger Bands” indicator. This gives the indicator adaptability.
- The limits value regulates the number of bars for which the indicator will be built.
- Deviation is a decimal value that indicates the standard deviation. The lower the value, the narrower the indicator line width will be.
[/spoiler]