


Automate your work with charts with the All-In-One SRES channel indicator. This is a complete package designed to solve 3 issues: (1) when to open a trade, (2) what is a good exit point, and (3) what is the probability of success of the trade.
Durability and flexibility: All-In-One SRES calculates and draws support (Support), resistance (Resistance), expected range (Exected range) and compression channel (Squeeze channel), is extremely flexible for many trading strategies. Each option can be customized to your strategy and enabled / disabled at any time. Easily switch between preset color schemes.
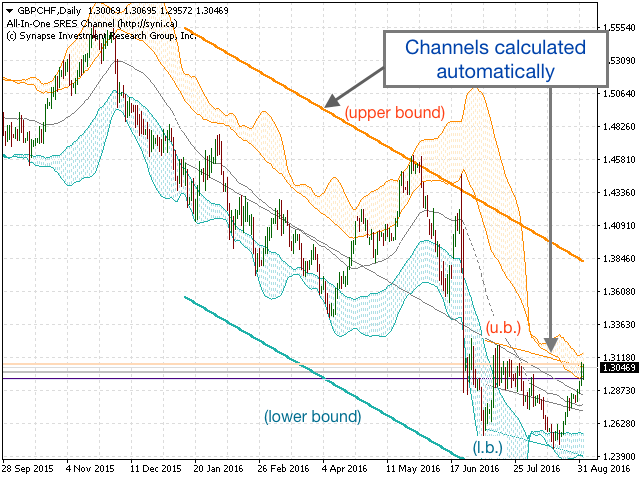
Support and resistance lines:
- Multiple linear regression analysis calculates short-term and long-term channels in real time, which can be useful for trading in a range, as well as major and minor support and resistance levels. This is especially useful when capturing trends on different periods that are easy to miss, and also to save time on searching and drawing lines, which allows you to focus on the price action.
Compression channel (with email notifications):
- Uses ranges based on standard deviation and modified ATR. The StDev bands inside the ATR bands indicate ‘compression’ and indicate the probability of a strong price movement. The space between the StDev and ATR lanes indicates the margin for directional traffic.
[spoiler title=”Read More…”]
High, Low, and Open:
- High, Low and Open prices are automatically drawn as support/resistance lines, and the period can be specified (hourly, daily, weekly, etc.)
Expected range:
- Based on the history of price movement, it draws the probabilistically expected price movement up and down. Adjusted over time, useful for opening a trade with a probability on your side. For example, if the average daily range of an asset (High-Low) is 120 pips, and for the current day the price has already risen by 110 pips from the opening price, then the probability of further strong upward movements (more than ~10 pips) decreases. This is automatically indicated on the chart.
- Expect compression that lasts for more than 4 candles using the compression channel. When the squeeze is over, trade in the direction of the price movement.
- Using the expected range, check what price movement is likely during the day, based on historical averages. To open a trade in a given direction, there must remain > 10 pips from the expected range.
- Use the short-term and long-term support and resistance lines of multiple linear regression as potential exit points after opening a trade, as well as to detect larger trends (do not trade against the trend).
- Use the High, Low, and Open lines as strong support/resistance levels (in particular, High and Low)
- Color Scheme: Select one of three predefined color schemes
- StDATR: Plot StD/ATR channel squeeze: True=the construction of the canal compression
- StDATR: Channel Period (Default=34): Number of bars to build the channel
- StDATR: Channel Shift (Default=0): Channel offset by N bars forward (positive value) or backward (negative value) in time
- StDATR: Channel Deviations (Default=2.5): the number of standard deviations from the average value for calculating the standard deviation channel
- StDATR: Squeeze release alerts: True=notify when the end of the compression
- StDATR: Turn on alerts message: Notifications in the popup window
- StDATR: Turn on alerts sound: beeps
- StDATR: Turn on alerts email: Sending messages by email (SMTP must be specified in the MT4 settings)
- LinReg: Plot short term support/resistance: True=draw a short term regression channel
- LinReg: Plot long term support/resistance: True=draw long term regression channel
- LinReg: Short length (Default=50): the number of bars for calculating the short-term channel
- LinReg: Long length (Default=200): number of bars used to calculate the long-term channel
- LinReg: Use CLOSE (instead of high/low) (Default=true): Use the Close price instead of High/Low when calculating channels
- HiLo: Plot daily H/L/O: True=draws a horizontal line that indicates the current High/Low/Open values of a certain period (by default, daily)
- HiLo: Plot expected high/low/headroom remaining: True=draws lines and fills the space between the current High/Low values for the specified period, as well as the probabilistically expected High/Low values
- HiLo: Period (in min) for high/low/open lines (Default=1440): Period in minutes for all calculations High/Low. 0=current timeframe, 1 minute; 5 minutes; 15 minutes; 30 minutes; 60=1 hour; 240=4 hours; 1440=1 day; 10080=1 week; 43200=1 month
[/spoiler]