


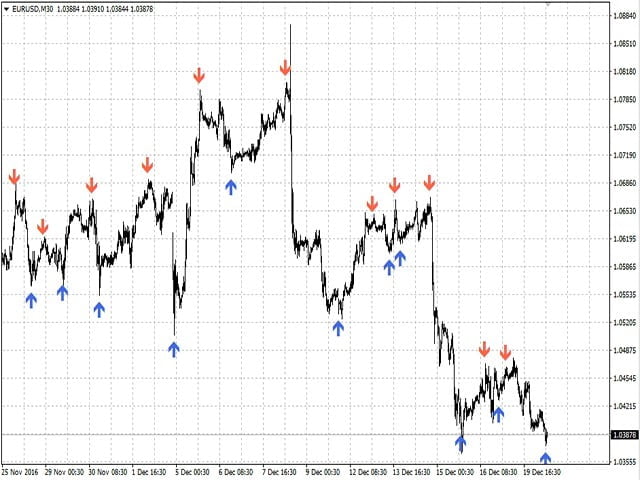

Arrow indicator of the trend. Uses the calculation algorithm to find possible price reversals. It can be used as an additional or auxiliary tool for your trading strategy. The current timeframe on which the indicator is set is used.
When calculating on a new bar, it counts how many candles exceeded the previous high and how many candles were below the previous low. Then it counts the ratio of one to the other and if there are more candles that have exceeded the maximum, it gives an arrow to buy. If there are more candles below the minimum, it gives an arrow to sell. The maximum and minimum are calculated not for the previous candle, but for the entire specified period up to the settlement one.
? Telegram chat for questions and discussion:
- Inp_Period – number of candlesticks to analyze
- Inp_BarsHistory – history depth for displaying arrows
- Inp_BarsCount – the number of candles that exceeded the maximum / minimum
- Inp_Shadow-take into account the maximum / minimum or only the opening/closing prices
- Inp_ArrowIndent – indent distance for arrows
- Inp_Alert – sound alert when a signal appears
- Inp_SendMail-notification by e-mail when a signal appears
- Inp_SendNotification – push notifications when a signal appears