


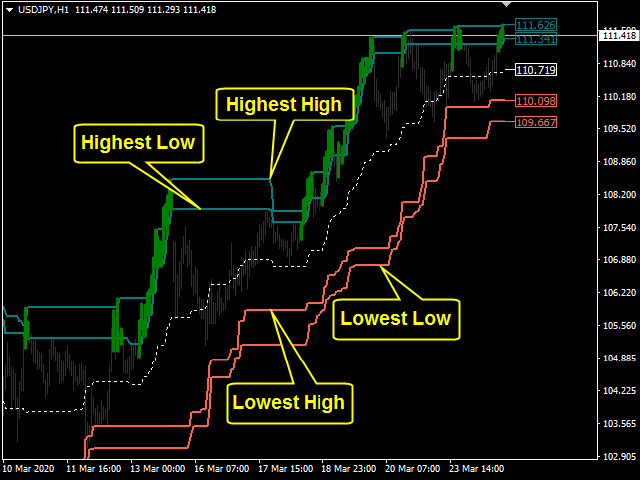

⭐⭐⭐⭐⭐ This is a price channel that shows five important price levels on the chart. Those levels are:
- The Highest High (HH) of the previous x bars.
- The Highest Low (HL) of the previous x bars.
- The Center Line.
- The Lowest High (LH) of the previous x bars.
- The Lowest Low (LL) of the previous x bars.
- Try Bermaui Channel Demo version: https://www.mql5.com/en/market/product/47663
- How to use the buffers to build your own expert advisor: https://www.mql5.com/en/blogs/post/734560
- Try Bermaui Channel Demo version: https://www.mql5.com/en/market/product/47663
- How to use the buffers to build your own expert advisor: https://www.mql5.com/en/blogs/post/734560
Think of the distance between HH and HL levels as an overbought area.
[spoiler title=”Read More…”]
When the price candles or bars crosses the HL to the upside this indicates that prices are getting inside its overbought area.
When the price candles or bars crosses the HL to the downside this indicate that prices are getting outside its overbought area.
When the price candles cross the HH it creates a new high. This might indicate the beginning of a new uptrend that continues in progress until
prices reverse its direction back again to the downside.
Think of the distance between LL and LH as an oversold area.
When the price candles or bars crosses the LH to the downside this indicates that prices are getting inside its oversold area.
When the price candles or bars crosses the LH to the upside this indicates that prices are getting outside its oversold area.
When the price candles cross the LL it creates a new low. This might indicate the beginning of a new downtrend that continues in progress until
prices reverse its direction back again to the upside.
- Bermaui Channel does not repaint or recalculate its results.
- It works on cryptocurrencies, stock, index, oil, gold, and on all time frames.
- Sound, email alerts and Mobile Notification.
- Buy, sell arrows to help to identifying trend signals.
- Well-designed parameters to help the user easily navigate between them.
- Buffer to build your own expert advisors.
- Two different color lists to choose from.
- The ability to draw overbought