


The indicator uses the values of the standard technical indicator iBands as the source data.
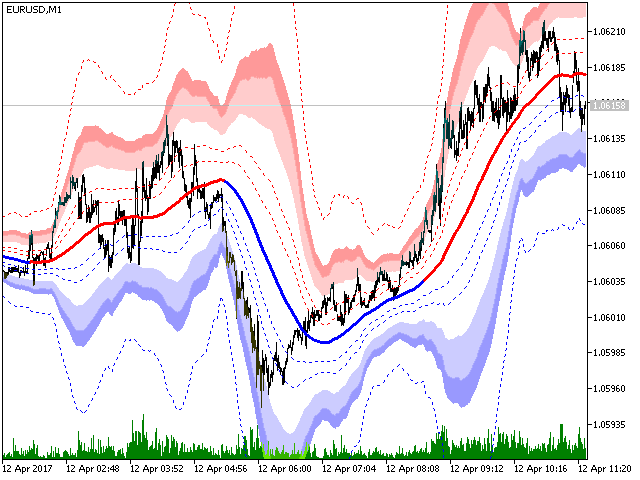
The Bollinger bands are built on the extended Fibonacci levels. The value of the number of standard deviations specified in the source data is selected as the base for calculating the levels.
In addition, by selecting the appropriate Fibonacci level, the indicator will show the buy (blue) and sell (red) zones. The signals are formed after the breakout of the corresponding Fibonacci level and are displayed on the middle line of the indicator (“Trend line”).
- BB_period – the period of the moving average (from 10 to 200);
- BB_deviation – the number of standard deviations (from 1.0 to 20.0);
- BB_applied_price – price type;
- BB_bands_shift-shift;
- fibo_signals – the Fibonacci level that is used to determine the buy and sell zones;
- history – the display range of the indicator.