


Do you remember how often it happened where a trade looked so obvious to you but immediately reversed? Hitting your stop loss? But you were so
sure about your trade and the direction.
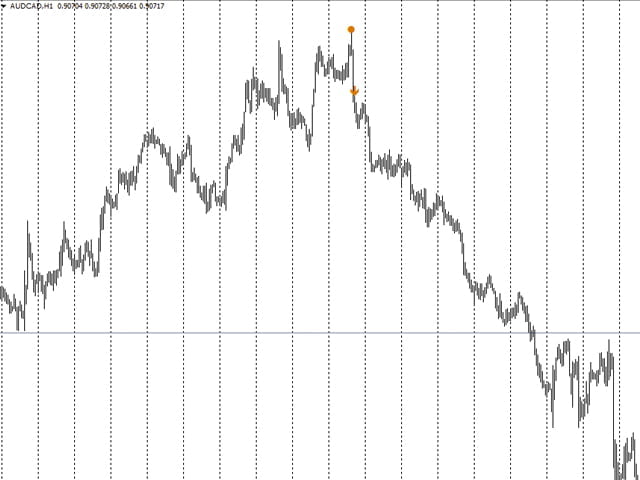
A bull trap occurs when traders take a long position and then have price reverse and move lower with huge momentum. This pattern often
follows a very similar rhythm of luring traders into “obvious” long trades, followed by a sudden move against them. Bull traps often happen
around previous highs where it looks as if the price is continuing the rally.
Especially amateur traders often tend to enter at that point, thinking the ongoing trend will continue in their favor. When price then reverses, they
hold on to their positions until their stops are hit or exit the position. This behavior brings even more momentum into the reversal.This
pattern is caused most likely by market makers or the so called smart money. They trap the majority of the herd of retail/amateur traders and
eating up their positions.
If you know how to trade these traps and follow the smart money, you will trade setups with a high probability and a huge risk/reward ratio.
But without hours of practicing it would probably still be really hard for you to decide if the chart in front of you really shows a bull or bear
trap. I developed a
n indicator which shows you the traps in real-time. It does not re- or backpaint. As soon as the neckline gets broken, the trap will be
marked on the chart.
[spoiler title=”Read More…”]
There are 2 different ways to trade these setups. Keep in mind that an indicator only gives you an indication. You need a bigger edge to verify if
the setup has a high probability.
Please read the following articles to trade the indicator in the correct way.
Method 1:
Method 2:
Enjoy and HAPPY TRADING!!!
[/spoiler]