


This indicator provides all the useful information about the symbol, account, positions and profit.
It is designed to improve traders ‘ money management.
Calc can be divided into several blocks. Each block can be hidden, its color and other properties can be adjusted.
Symbol Information Block:
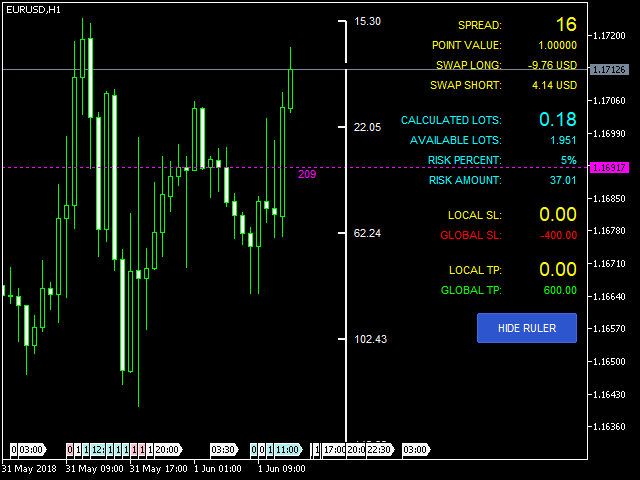
This block displays information about the current spread( SPREAD), the value of the point (POINT VALUE – in the currency of the deposit for 1 lot), the swap for long (SWAP LONG) and short trades (SWAP SHORT).
- Show symbol info – show / hide this block
- Color of symbol info – the color of this block
Account Information Block:
This block displays information about the calculated lot (CALCULATED LOTS – the volume for opening positions in accordance with the capital management), available lots (AVAILABLE LOTS – the maximum volume that can be opened), the percentage of risk (RISK PERCENT) and the amount of risk (RISK AMOUNT) in accordance with the capital management set in the input parameters
Learn more about settlement lots:
Calculated using the stop loss line (horizontal dotted line of Magenta color). This line represents a virtual stop loss relative to the current price. It measures the range between them. The value of this range is used when calculating the final volume in accordance with capital management. You can set the money management as a percentage of the current balance or as an absolute value. You can fine-tune your stop loss by moving the line up or down. All relevant data will be recalculated immediately.
[spoiler title=”Read More…”]
Learn more about available lots:
This is the maximum volume for opening a position. It works on FOREX and CFD instruments.
- Show account info – show / hide this block
- Color of account info – the color of this block
- Color of stop loss line – color of the stop loss line
- Risk value – the risk value in absolute value or as a percentage of the balance, see the following parameter
- Risk type – the type of risk, in absolute value or as a percentage of the balance
Block of information about open positions:
This block displays information about the value of the stop loss and take profit on the current symbol and on all symbols (if there are open positions on several symbols). Useful when you need to monitor your profit/loss.
- Show open position info – show / hide this block
- Positive color – the color of the positive value (profit)
- Negative color – the color of the negative value (loss)
- Default color – color when there are no positions
A legend is provided for all these blocks. The legend can be displayed/hidden (the “Show legend” parameter) and moved left/right (the “Legend horizontal position” parameter).
This is a special tool that is designed to quickly calculate the possible profit/loss. When you enable this tool, a “ruler” appears on the right side of the chart. With this ruler, you can easily track your current profit/loss according to your money management.
The ruler has two modes:
You can specify the number of values to display, adjust the colors, and enable / disable the display using the button.
Ruler parameters:
- Show ruler – show / hide the ruler, you can also use the button on the right side of the chart
- Density of ruler – the number of displayed values
- Show always bid price on ruler – show only Bid prices on the ruler (useful for opening only short positions, when it is fashionable to ignore Ask prices)
- Color of positive ruler – color of positive values (profit)
- Color of negative ruler – color of negative values (loss)
- Color of ruler labels – color of the values on the ruler
- Color of ruler button for deactivate – color of ruler button for deactivate
- Color of ruler button for activate – the color of the ruler button to activate
[/spoiler]