


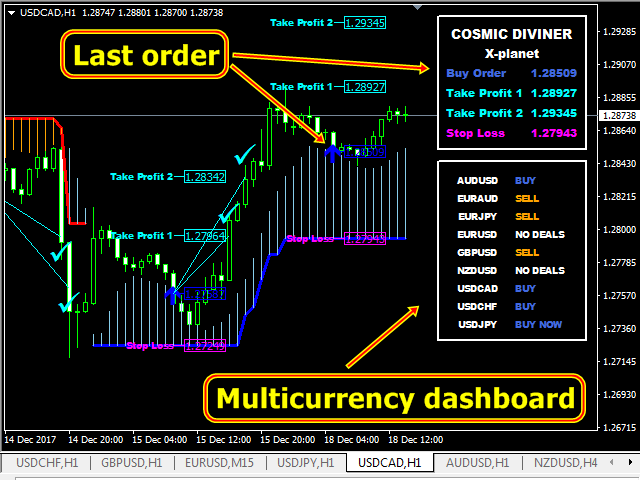

A unique multi-currency author’s strategy that simultaneously determines the strength of trends and market entry points, visualizing it with the help of histograms on the chart. The indicator is optimally adapted for trading on the time periods M5, M15, M30, H1. At the same time, for the convenience of the user, an entry point (in the form of an arrow), recommended profit levels (TP1, TP2 with text labels) and a recommendation for setting a Stop Loss always appear at a certain point.
Profit levels (TP1, TP2) are automatically calculated for each trading period, depending on the volatility of the currency pair on which the indicator is installed.
The strength of the global and local trading trend and the visualization of the histograms on the chart are calculated using a variety of proprietary formulas and algorithms.
The Cosmic Diviner X Planet indicator never redraws.
- Entry points:
- Buy signal – blue up arrow, text label with recommended purchase price;
- The sell signal is a red down arrow, a text label with the recommended selling price.
- Take Profit Levels:
- Take Profit Level 1 – blue price tag with recommended price Tp1;
- Take Profit Level 2 is a blue price tag with a recommended price of Tp2.
- Stop Loss Level:
- The recommended Stop Loss zone is displayed as a purple price tag.
- Options for using the strategy:
- When a buy or sell signal appears, open an order (Sell or Buy) and set a Stop Loss;
- When the price reaches the Take Profit level 1, close half of the order and move the Stop Loss insurance to breakeven;
- When the price reaches the Take Profit level 2, close the order.
[spoiler title=”Read More…”]
- Buy signal – blue up arrow, text label with recommended purchase price;
- The sell signal is a red down arrow, a text label with the recommended selling price.
- Take Profit Level 1 – blue price tag with recommended price Tp1;
- Take Profit Level 2 is a blue price tag with a recommended price of Tp2.
- The recommended Stop Loss zone is displayed as a purple price tag.
The peculiarity of the indicator visualization on the chart is that the indicator has a delay of 3 ticks to collect market information, because of this, it does not work on weekends. The strategy tester does not have this three-tick delay.
- Depth of Dynamic Level – the depth of the dynamic level;
- Take Profit 1 Index – Take Profit 1 Index;
- Take Profit 2 Index – the index of the Take Profit 2;
- Stop Loss at the Dynamic Level – Stop Loss at the dynamic level;
- Stop Loss Index-works if no Stop Loss is used at the dynamic level;
- Show Table (close in tester mode to increase speed) – show indicator information tables (when enabled, reduce the speed of testing);
- Alert (Buy, Sell, TP, SL) – alert for Buy, Sell, TP, SL;
- Push-notification Deal Found – Push notification for finding a deal;
- Push-notification TP and SL-Push-notification Take Profit, Stop Loss;
- Send Mail Notification-send notifications to email.
[/spoiler]