


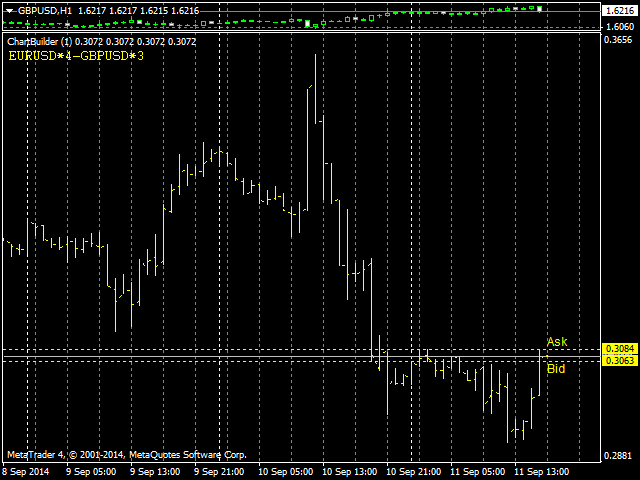

The indicator is designed for easy construction of synthetic charts with the participation of various financial instruments. It will be useful both for fans of arbitrage or pair trading, and for various researchers. Its main advantage is its simplicity and clarity. Each graph is given in the form of a regular mathematical formula. For example, if you need to plot the spread (difference) between EURUSD and GBPUSD with coefficients of 4 and 3, respectively, then enter the following formula:
We get the graph shown in the screenshot. But this is one of the simplest examples. The indicator allows you to build much more complex and interesting things. And also track certain price levels set by the user, when reaching which a signal will be sent.
The detailed description of the indicator can be found on the tab