


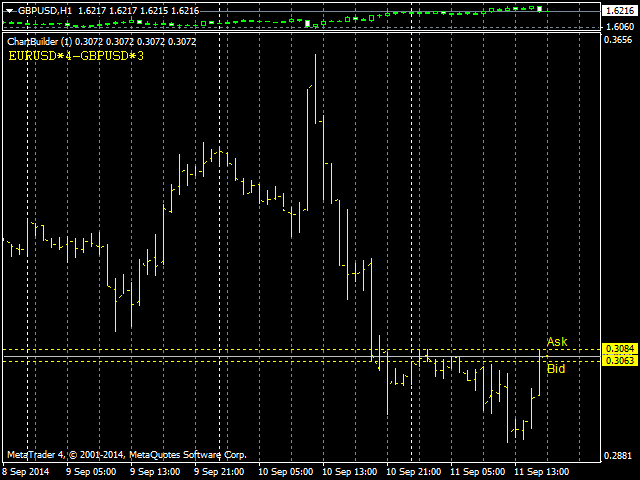

The indicator is designed for easy construction of synthetic charts with the participation of various financial instruments. It will be useful for both lovers of arbitrage or pair trading, and various researchers. Its main advantage is simplicity and visibility. Each graph is given in the form of a regular mathematical formula. For example, if you need to plot the spread (difference) between EURUSD and GBPUSD with coefficients 4 and 3, respectively, then enter the following formula:
EURUSD * 4 – GBPUSD * 3
EURUSD * 4 – GBPUSD * 3
We will get the graph shown in the screenshot. But this is one of the simplest examples. The indicator allows you to build much more complex and interesting things. And also track certain price levels set by the user, at which a signal will be given.
A detailed description of the indicator can be found on the Discussion tab.
- Formula1
- Formula2
- …
- Formula12 – formulas are set for each graph
- Precision Digits – the accuracy of the displayed indicator values (the number of decimal places).
- TimeShift_minutes – time shift of all charts relative to the timeline (in minutes)
- TimeSnap_Mode – the mode of binding the obtained formula values to the displayed bars of the indicator by time. It can be set in bars (“bars“), or in minutes (“minutes“).
- TimeSnap_Size – the maximum size of the binding. If the time lag between the calculated bar and the actual bar exceeds this size, the bar is not drawn on the screen. If -1 is set, there is no binding constraint.
- Draw Mode – the mode of drawing the graph:
- LINE (line)
- BARS (bars)
- SECTION (segments between non-empty values)
- HISTOGRAM (histogram)
- POINTS (points)
- AUTO (automatic selection according to the selected display mode in the main window)
- Interpolation Timeframe – a timeframe for interpolating intra-bar values when constructing synthetic bars. By default M1
- Auto Scale – auto scale mode of graphs. The number of the main graph is indicated, under the height of which all other graphs are adjusted.
- Show Labels – select the location of formula names in the graph window (left or right)
- Show Bid/Ask – displaying synthetic Bid/Ask levels for each chart
- Signal_ChartNumber – the number of the chart for which signal values and signal lines are used.
- Signal_HighValue – the upper signal value, upon reaching which a signal will start to be sent
- Signal_LowValue – lower signal value
- Signal_HighLine – the name of the upper signal line, upon reaching which the signal will be sent
- Signal_LowLine – name of the lower signal line
- Signal_CrossCharts – numbers of graphs (separated by a space or comma), at the intersection of which a signal will be sent.
- Signal_Pause – pause between repetition of identical signals (in seconds)
- Save_ChartNumber – the number of the graph whose values will be saved to a text file.
- Save_FileName – the name of the text file where the graph values are saved
- Save_FileDelimiter is the text separator used in the file. If nothing is specified, the tab character is used.
[spoiler title=”Read More…”]
- LINE (line)
- BARS (bars)
- SECTION (segments between non-empty values)
- HISTOGRAM (histogram)
- POINTS (points)
- AUTO (automatic selection according to the selected display mode in the main window)
[/spoiler]