


Currency Correlation Plus is a more expensive version of the Currency Correlation indicator. The indicator is equipped with signals and has more functions.
It allows you to see and analyze correlations. Having a second chart helps you analyze and trade multiple currencies at once. You can place multiple pairs on the chart. Enter the desired pair in the settings and add it to the chart.
Cheaper version:
I also recommend that you familiarize yourself with the product:
- One indicator on chart – one indicator on the chart: True – one, False – two or more
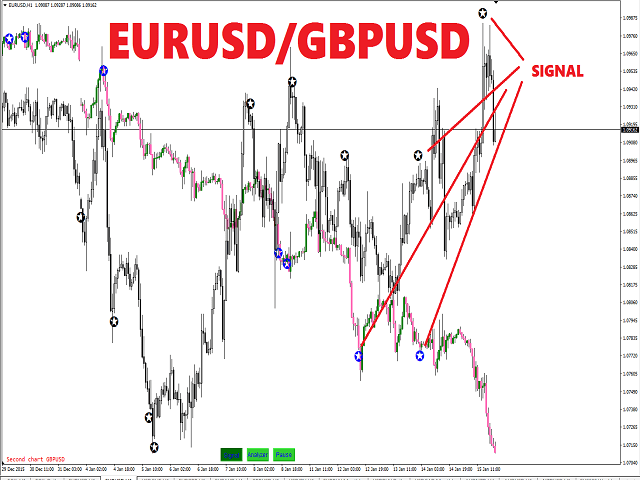
- Alert Signal buy and sell for first chart and second chart-buy and sell signal for the first and second charts
- Color scheme Black on White [Background] – color scheme “black on white” [background]
- To add a second pair, simply enter its character
- Body color of a bull candle – the body color of a bull candle
- Body color of a bear candle – the body color of a bear candle
- Shadow color and color of “Doji” Japanese candlestick”
- Color signal [first chart] – color of the signal [first chart]
- Color signal [second chart] – color of the signal [second chart]
- Analyzer-analyzer (see the screenshot). It works only on demo and live accounts, but not in the tester.
- Signal – signal (see the screenshot). It works only on demo and live accounts, but not in the tester.
- System H4/M5 – system H4/M5 (see screenshot)
[spoiler title=”Read More…”]
- The Signal button. Buy and sell signals for the first and second charts. It works only on demo and live accounts, but not in the tester.
- The Analyzer button. The difference between the graphs. It works only on demo and live accounts, but not in the tester.
- The Pause button. Suspend the analyzer. It works only on demo and live accounts, but not in the tester.
- The Measure button. Calculations on the second graph. It works only on demo and live accounts, but not in the tester.
- The Sensitivity button. Plus / minus. It works only on demo and live accounts, but not in the tester.
- Max difference on chart: max. graph difference (first graph – second graph). [Maximum]
- Max difference in real: max real difference (first pair – second pair). [Maximum]
- Min difference in real: max. real difference (first pair – second pair). [Minimum]
- Difference on chart: the difference on the chart (first chart – second chart). [Bars analyzed on this chart]
- Difference in real: the real difference (first pair – second pair). [Bars analyzed on this chart]
Wingdings font on the chart:
- 115 – max. the difference in the graph.
- 159 – max. real difference.
- 158-min. real difference.
- 242 – the difference on the chart and the real one. The analyzer-step by step.
- 244 – the difference on the chart [current].
- 181 – buy/sell signal.
Reference:
[/spoiler]