


Each indicator has its own advantages and disadvantages. Trendlines show good signals during a trend, but lag during a flat. Flat ones feel great in a flat, but when a trend occurs, they immediately die. All this would not be a problem if it were simple to predict when the trend will change to flat, and the flat will change to trend, but in practice this is an extremely serious task.
What if we develop an algorithm that can eliminate the shortcomings in the indicator and strengthen its advantages? What if such an algorithm can improve the performance of the trend indicator in the flat, but at the same time, it will increase the efficiency in the trend, and the signals of the flat indicator can be corrected in the trend, and brought to perfection in the flat?
“Deep” is the algorithm that enhances the advantages of the indicator and minimizes its disadvantages. In short, this algorithm makes the indicator better. In an attempt to combine neural networks with a standard indicator, to my surprise, I got very interesting results.
Due to the uniqueness of the situations and the complex regularity, the problem is best solved by nonlinear algorithms. Neural networks are a very flexible and powerful tool that allows you to achieve a lot if the task is set correctly, and the solution is designed intelligently. This tool is the basis of the algorithm.
[spoiler title=”Read More…”]
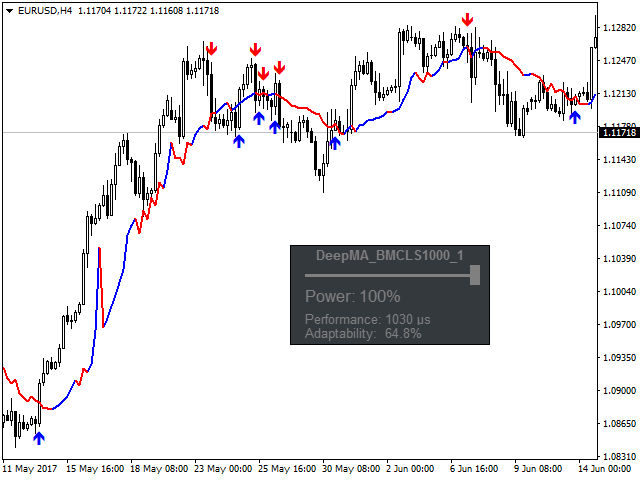
In fact, the algorithm calculates the optimal periods of the moving average over the entire area, depending on the state of the trend and the flat. In the flat section, the algorithm adapts the period of the moving average in the direction of the flat, in the trend section in the direction of the trend. By increasing the “Deep” depth, you will increase the flexibility of the adaptive properties of the algorithm.
The network architecture and the heuristic search algorithm were designed specifically to solve this problem. The layering and the number of neurons in the layer are dynamically adjusted, and the user is only required to specify the maximum number of neurons in the layer, the maximum layer size, and the maximum number of layers.
- Device – the device on which the indicator will be calculated. It can be either a CPU or a graphics processor.
- Graphic objects prefix name-the prefix of the name of the graphic objects (for example, the name of the panel).
- TimeFrame – the timeframe.
Moving Average
- Period – the period of the moving average
The “Deep” algorithm”
- Deep – used to adjust the depth of the moving average period.
- Deep Smoothing – smoothing the result.
- Deep Sensitivity – the sensitivity of the algorithm.
- Spread in points – the size of the spread for fine-tuning heuristics.
Neural Network
- Max: Number of Sensors – the maximum number of sensory neurons.
- Max: Layer Size – the maximum number of neurons in the layer.
- Max: Number of Layers – the maximum number of layers.
- Max: ratio of signal deformation – the coefficient is used to deform the signals.
- Max: Signal range – the range of signal changes.
- Signal digits – the accuracy of the signals.
Calculations
- Power – the calculation power is specified as a percentage from 1 to 100.
- Number of Bars – the number of bars to calculate.
Signal
- Signal mode – the type of signals.
- Q Method – method for calculating the adaptability. These algorithms are used to improve the adaptive characteristics of signals.
Visual effects
- Show Mode – display mode of the readings.
- Up Arrows Code – the code of the up arrows.
- Dn Arrows Code – the code of the down arrows.
- Arrows Vertical Shift ( in points) – the vertical shift of the arrows.
Notification
- Alerts? – display a dialog box?
- Play Sound? – play an audio file?
- File Name To Sound Play – the name of the sound file.
- Send To Mail? – send an email to an email address?
- Mail Header – the message header.
- Notifications? – send notifications to mobile terminals?
Panel
- Panel? – display the panel?
- Starting X – the horizontal starting position (in pixels).
- Starting Y – the vertical starting position (in pixels).
- Size multiplier – the size factor.
- Color – the background color of the panel.
- Transparent % – transparency (from 10 to 100).
- Border Color – the color of the border.
- Slider color – the color of the slider.
- Txt color – the color of the main text.
- Txt 2 color – the color of the rest of the text.
[/spoiler]