


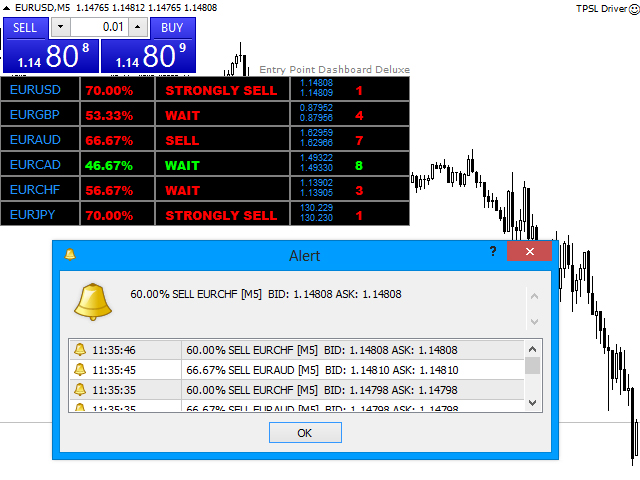

The Entry Point Dashboard Deluxe technical indicator provides
Buy/ Sell notifications for any 6 Currency Pairs by analyzing 5 Moving Averages, CCI, RSI,
Stochastic, Bill Williams and Volume indicators using 3 different time
frames. It gives unlimited customization facility to all traders for getting more accurate signals by following their experience. The Indicator displays a pop-up alert with sound for Buy/Sell signals.
Indicator main signal shows few levels. Wait, Buy, Strongly Buy, Sell and Strongly Sell. How it works? As an example:
M1=Sell M5=Sell M15=Sell then main signal is Sell or Strongly Sell.
- Most popular 6 indicators included
- Analyze 3 time frame data using same indicator values
- 6 Currency pairs available for dashboard
- Easy parameters and fully customizable for user own strategy
- Suitable for every symbols and time frames
- Indicate all signals quickly and notify normal level signals (Buy, Sell) by pop-up alert with sound
- Each notification Activate/ Deactivate function
- 10 Times activation facility
Parameters
- Common Filters
- Symbols – Currency pair list
- Time Period 1 – Lower time period for analyze indicator data
- Time Period 2 – Normal time period for analyze indicator data
- Time Period 3 – Higher time period for analyze indicator data
- Range – Use candle data between [x] to 0 candle
- Moving Average Filters
- Period 1 – Moving average period 1
- Period 2 – Moving average period 2
- Period 3 – Moving average period 3
- Period 4 – Moving average period 4
- Period 5 – Moving average period 5
- CCI Signal Filters
- Level – CCI level for buy/sell signal
- Averaging Period – Averaging period for calculation
- Applied Price – Applied price
- RSI Signal Filters
- Overbought Level – RSI level for sell signal
- Oversold Level – RSI level for buy signal
- Averaging Period – Averaging period for calculation
- Applied Price – Applied price
- Stochastic Signal Filters
- Overbought Level – Stochastic level for sell signal
- Oversold Level – Stochastic level for buy signal
- K period – Period of the %K line
- D period – Period of the %D line
- Slowing – Slowing value
- Method – Moving Average method
- Price Field (0 or 1) – Price field parameter. Can be one of this values: 0 – Low/High or 1 – Close/Close
- Alert Filters
- Pop Up Alert – Activate/ Deactivate pop up message alerts
- Graphic Parameters
- X Distance – Distance from right to left for dashboard
- Y Distance – Distance from top to bottom for dashboard
- Columns – Dashboard separate by [x] symbols
- Buy Color – Color for buy signal
- Sell Color – Color for sell signal
- No Signal Color – Color for wait signal
- Label Color – Color for labels
Entry Point Dashboard Deluxe is a one product of the Entry Point Dashboard series and it completely based on the Entry Point Indicator algorithm.
- Entry Point Dashboard Free
- Entry Point Dashboard Economy
- Entry Point Dashboard Deluxe
- Entry Point Dashboard Ultimate
[spoiler title=”Read More…”]
- Common Filters
- Symbols – Currency pair list
- Time Period 1 – Lower time period for analyze indicator data
- Time Period 2 – Normal time period for analyze indicator data
- Time Period 3 – Higher time period for analyze indicator data
- Range – Use candle data between [x] to 0 candle
- Moving Average Filters
- Period 1 – Moving average period 1
- Period 2 – Moving average period 2
- Period 3 – Moving average period 3
- Period 4 – Moving average period 4
- Period 5 – Moving average period 5
- CCI Signal Filters
- Level – CCI level for buy/sell signal
- Averaging Period – Averaging period for calculation
- Applied Price – Applied price
- RSI Signal Filters
- Overbought Level – RSI level for sell signal
- Oversold Level – RSI level for buy signal
- Averaging Period – Averaging period for calculation
- Applied Price – Applied price
- Stochastic Signal Filters
- Overbought Level – Stochastic level for sell signal
- Oversold Level – Stochastic level for buy signal
- K period – Period of the %K line
- D period – Period of the %D line
- Slowing – Slowing value
- Method – Moving Average method
- Price Field (0 or 1) – Price field parameter. Can be one of this values: 0 – Low/High or 1 – Close/Close
- Alert Filters
- Pop Up Alert – Activate/ Deactivate pop up message alerts
- Graphic Parameters
- X Distance – Distance from right to left for dashboard
- Y Distance – Distance from top to bottom for dashboard
- Columns – Dashboard separate by [x] symbols
- Buy Color – Color for buy signal
- Sell Color – Color for sell signal
- No Signal Color – Color for wait signal
- Label Color – Color for labels
- Symbols – Currency pair list
- Time Period 1 – Lower time period for analyze indicator data
- Time Period 2 – Normal time period for analyze indicator data
- Time Period 3 – Higher time period for analyze indicator data
- Range – Use candle data between [x] to 0 candle
- Period 1 – Moving average period 1
- Period 2 – Moving average period 2
- Period 3 – Moving average period 3
- Period 4 – Moving average period 4
- Period 5 – Moving average period 5
- Level – CCI level for buy/sell signal
- Averaging Period – Averaging period for calculation
- Applied Price – Applied price
- Overbought Level – RSI level for sell signal
- Oversold Level – RSI level for buy signal
- Averaging Period – Averaging period for calculation
- Applied Price – Applied price
- Overbought Level – Stochastic level for sell signal
- Oversold Level – Stochastic level for buy signal
- K period – Period of the %K line
- D period – Period of the %D line
- Slowing – Slowing value
- Method – Moving Average method
- Price Field (0 or 1) – Price field parameter. Can be one of this values: 0 – Low/High or 1 – Close/Close
- Pop Up Alert – Activate/ Deactivate pop up message alerts
- X Distance – Distance from right to left for dashboard
- Y Distance – Distance from top to bottom for dashboard
- Columns – Dashboard separate by [x] symbols
- Buy Color – Color for buy signal
- Sell Color – Color for sell signal
- No Signal Color – Color for wait signal
- Label Color – Color for labels
Entry Point Dashboard Deluxe is a one product of the Entry Point Dashboard series and it completely based on the Entry Point Indicator algorithm.
- Entry Point Dashboard Free
- Entry Point Dashboard Economy
- Entry Point Dashboard Deluxe
- Entry Point Dashboard Ultimate
Entry Point Dashboard Deluxe is a one product of the Entry Point Dashboard series and it completely based on the Entry Point Indicator algorithm.
- Entry Point Dashboard Free
- Entry Point Dashboard Economy
- Entry Point Dashboard Deluxe
- Entry Point Dashboard Ultimate
Entry Point Dashboard Deluxe is a one product of the Entry Point Dashboard series and it completely based on the Entry Point Indicator algorithm.
- Entry Point Dashboard Free
- Entry Point Dashboard Economy
- Entry Point Dashboard Deluxe
- Entry Point Dashboard Ultimate
[/spoiler]