


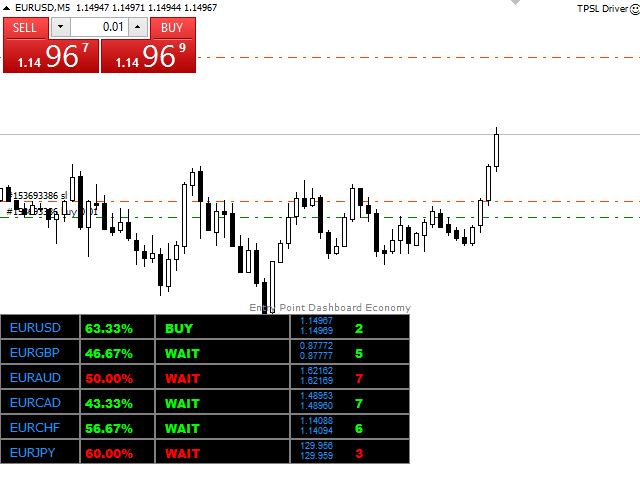

The Entry Point Dashboard Economy technical indicator provides
Buy/ Sell signals for any 6 Currency Pairs by analyzing 5 Moving Averages, CCI, RSI,
Stochastic, Bill Williams and Volume indicators using 3 different time
frames. It gives basic resources customization facility to traders. The Indicator show all signals on the dashboard.
Indicator main signal shows few levels. Wait, Buy, Strongly Buy, Sell and Strongly Sell. How it works? As an example:
M1=Sell M5=Sell M15=Sell then main signal is Sell or Strongly Sell.
- Most popular 6 indicators included
- Analyze 3 time frame data using same indicator values
- 6 Currency pairs available for dashboard
- Easy parameters and basic resources customizable
- Suitable for every symbols and time frames
- Indicate all signals quickly
Parameters
- Common Filters
- Symbols – Currency pair list
- Time Period 1 – Lower time period for analyze indicator data
- Time Period 2 – Normal time period for analyze indicator data
- Time Period 3 – Higher time period for analyze indicator data
- Range – Use candle data between [x] to 0 candle
- Graphic Parameters
- X Distance – Distance from right to left for dashboard
- Y Distance – Distance from top to bottom for dashboard
- Columns – Dashboard separate by [x] symbols
- Buy Color – Color for buy signal
- Sell Color – Color for sell signal
- No Signal Color – Color for wait signal
- Label Color – Color for labels
Entry Point Dashboard Economy is a one product of the Entry Point Dashboard series and it completely based on the Entry Point Indicator algorithm.
- Entry Point Dashboard Free
- Entry Point Dashboard Economy
- Entry Point Dashboard Deluxe
- Entry Point Dashboard Ultimate
[spoiler title=”Read More…”]
- Common Filters
- Symbols – Currency pair list
- Time Period 1 – Lower time period for analyze indicator data
- Time Period 2 – Normal time period for analyze indicator data
- Time Period 3 – Higher time period for analyze indicator data
- Range – Use candle data between [x] to 0 candle
- Graphic Parameters
- X Distance – Distance from right to left for dashboard
- Y Distance – Distance from top to bottom for dashboard
- Columns – Dashboard separate by [x] symbols
- Buy Color – Color for buy signal
- Sell Color – Color for sell signal
- No Signal Color – Color for wait signal
- Label Color – Color for labels
- Symbols – Currency pair list
- Time Period 1 – Lower time period for analyze indicator data
- Time Period 2 – Normal time period for analyze indicator data
- Time Period 3 – Higher time period for analyze indicator data
- Range – Use candle data between [x] to 0 candle
- X Distance – Distance from right to left for dashboard
- Y Distance – Distance from top to bottom for dashboard
- Columns – Dashboard separate by [x] symbols
- Buy Color – Color for buy signal
- Sell Color – Color for sell signal
- No Signal Color – Color for wait signal
- Label Color – Color for labels
Entry Point Dashboard Economy is a one product of the Entry Point Dashboard series and it completely based on the Entry Point Indicator algorithm.
- Entry Point Dashboard Free
- Entry Point Dashboard Economy
- Entry Point Dashboard Deluxe
- Entry Point Dashboard Ultimate
Entry Point Dashboard Economy is a one product of the Entry Point Dashboard series and it completely based on the Entry Point Indicator algorithm.
- Entry Point Dashboard Free
- Entry Point Dashboard Economy
- Entry Point Dashboard Deluxe
- Entry Point Dashboard Ultimate
Entry Point Dashboard Economy is a one product of the Entry Point Dashboard series and it completely based on the Entry Point Indicator algorithm.
- Entry Point Dashboard Free
- Entry Point Dashboard Economy
- Entry Point Dashboard Deluxe
- Entry Point Dashboard Ultimate
[/spoiler]