


Extract Candle Power indicator-highlights the volumes of sellers and buyers from the candle in real time. You can also analyze the volumes of several previous candlesticks and determine the trend direction more accurately than using a traditional moving average.
The allocated volume of sellers and buyers is very useful for determining the current position of traders. In addition, you can compare the actual state of the current candlesticks using the moving average to find the pivot points. Extract Candle Power works on all timeframes, the signals for making decisions will be more accurate on higher timeframes. However, you can choose any timeframe and any currency according to your strategy.
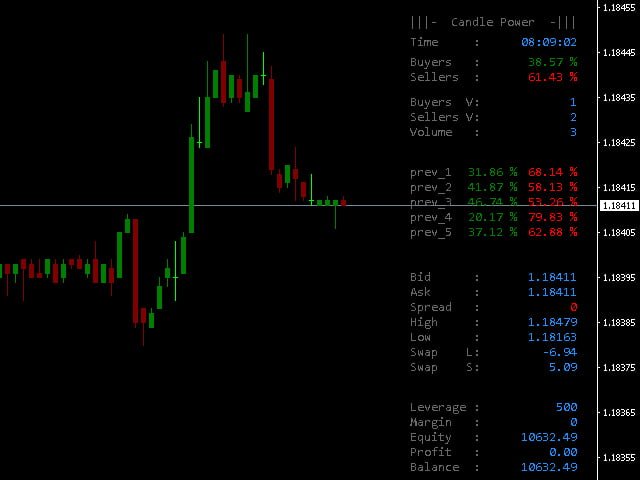
- Your broker’s server time.
- The volume of buyers as a percentage of the total volume.
- The volume of sellers as a percentage of the total volume.
- The volume of the candle.
- The volumes of buyers and sellers of several previous candlesticks.
- Bid Price.
- Ask price.
- The real spread of your broker.
- The price is High per day.
- Low price per day.
- Swap values.
- Leverage.
- Margin.
- The value of the funds.
- Profit – take profit.
- Balance.
[spoiler title=”Read More…”]
- Parameters for displaying past volume data
- Buyers Color – the color of the percentage of buyers at the maximum of the candle.
- Sellers Color – the color of the percentage of sellers at the minimum of the candle.
- Font – the font.
- Font Size – the font size.
- Information Panel display options
- Label Color – the color of all the labels on the dashboard.
- Font – font for the information panel.
- Font Size – the font size for the dashboard.
- Y Distance – vertical distance.
- Step – the step between the lines.
- Parameters for displaying data in the volume section
- Volume Section Display-enable / disable the display of the section.
- Buyers Volume Color – the color of the volume of buyers.
- Sellers Volume Color – the color of the sellers ‘ volume.
- Total Volume Color – the color of the total volume.
- Label X Distance – horizontal distance for labels.
- Data X Distance – the horizontal distance for the total volume data.
- Parameters for displaying data in the Session information section
- Sessions Section Display-enable / disable the display of the section.
- Sydney Color – the color of the Sydney session.
- Tokyo Color – the color of the Tokyo session.
- London Color – the color of the London session.
- New York Color – the color of the New York session.
- Sessions Label X Distance – the horizontal distance for the labels.
- Sessions Time X Distance – horizontal distance for session time information.
- Parameters for displaying data in the market information section
- Market Section Display – enable / disable the display of the section.
- Time Color – the color of the time.
- Bid Color – the color of the Bid price.
- Ask Color – the color of the Ask price.
- Spread Color – the color of the spread.
- Higher Price Color – the color of the daily maximum price.
- Lower Price Color – the color of the daily minimum price.
- Swap Long Color – swap color for buy orders.
- Swap Short Color – swap color for sell orders.
- Label X Distance – horizontal distance for labels.
- Data X Distance – the horizontal distance for the data.
- Parameters for displaying data in the account information section
- Account Section Display-enable / disable the display of the section.
- Leverage Color – the color of the leverage.
- Margin Color – the color of the margin.
- Equity Color – the color of your own funds.
- Profit Color – the color of the profit.
- Balance Color – the color of the account balance.
- Label X Distance – horizontal distance for labels.
- Data X Distance – the horizontal distance for the data.
- Y Distance – vertical distance.
- Buyers Color – the color of the percentage of buyers at the maximum of the candle.
- Sellers Color – the color of the percentage of sellers at the minimum of the candle.
- Font – the font.
- Font Size – the font size.
- Label Color – the color of all the labels on the dashboard.
- Font – font for the information panel.
- Font Size – the font size for the dashboard.
- Y Distance – vertical distance.
- Step – the step between the lines.
- Volume Section Display-enable / disable the display of the section.
- Buyers Volume Color – the color of the volume of buyers.
- Sellers Volume Color – the color of the sellers ‘ volume.
- Total Volume Color – the color of the total volume.
- Label X Distance – horizontal distance for labels.
- Data X Distance – the horizontal distance for the total volume data.
- Sessions Section Display-enable / disable the display of the section.
- Sydney Color – the color of the Sydney session.
- Tokyo Color – the color of the Tokyo session.
- London Color – the color of the London session.
- New York Color – the color of the New York session.
- Sessions Label X Distance – the horizontal distance for the labels.
- Sessions Time X Distance – horizontal distance for session time information.
- Market Section Display – enable / disable the display of the section.
- Time Color – the color of the time.
- Bid Color – the color of the Bid price.
- Ask Color – the color of the Ask price.
- Spread Color – the color of the spread.
- Higher Price Color – the color of the daily maximum price.
- Lower Price Color – the color of the daily minimum price.
- Swap Long Color – swap color for buy orders.
- Swap Short Color – swap color for sell orders.
- Label X Distance – horizontal distance for labels.
- Data X Distance – the horizontal distance for the data.
- Account Section Display-enable / disable the display of the section.
- Leverage Color – the color of the leverage.
- Margin Color – the color of the margin.
- Equity Color – the color of your own funds.
- Profit Color – the color of the profit.
- Balance Color – the color of the account balance.
- Label X Distance – horizontal distance for labels.
- Data X Distance – the horizontal distance for the data.
- Y Distance – vertical distance.
[/spoiler]