


This is a multi-timeframe indicator for notification of the appearance of the “Absorption” model. You can use it exclusively on the current timeframe, as well as on all timeframes from minute to month.
Does not redraw.
When using the used timeframe (in multi-timeframe mode) , you can view signals on the current timeframe and on higher timeframes.
For each selected timeframe, a separate setting of pop-up, email, and push notifications is available.
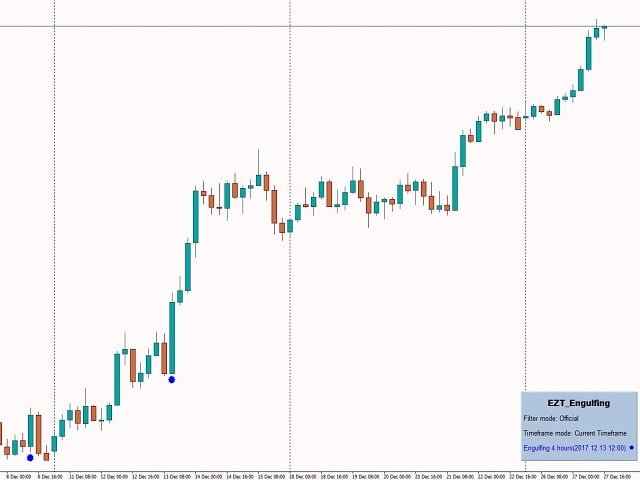
The indicator places a point on the price chart. For bullish “Takeover” patterns, they are below the price line; for bearish patterns, they are above the price line.
If you only want to receive notifications and not clutter the chart with dots, just select arrow colors: none.
- Candle limit to show arrows: the number of history bars to display arrows/dots.
- Timeframe selection mode: use the current or specified timeframes.
- Engulfing filter mode: filter mode for the “Absorption”, “Strong official”, “Official”, and “Unofficial” models. All three options take into account the average size of the last 20 candles, their lows and highs, as well as the opening and closing levels of the absorbing candle compared to the previous candle. The size of the body and the shadow of the candle are also taken into account. There are some minor differences between these three options. To work with the standard “Takeover” model, use the “Official” version.
- Strong Official: the body size of the previous candle is at least 30% of the average size of the last 20 candles. The distance from the maximum to the minimum of the absorbing candle should completely overlap the previous candle.
- Official: the body size of the previous candle is at least 15% of the average size of the last 20 candles. The distance from the maximum to the minimum of the absorbing candle overlaps or is equal to the size of the previous candle.
- Unofficial: The opening side of the absorbing candle does not have to overlap the previous candle. The closing level of the absorbing candle should cover the high/low of the previous candle.
- Arrow size: the size of the arrows.
- Arrow color: the color of the arrows.
- Pop up alert: Pop-up alerts, true/false.
- E-mail alert: Email alerts, true/false.
- Notification alert/ Push alert: notifications to the mobile terminal, true/false.
- “Manual Timeframes”: individual settings for each timeframe.
- “Draw higher timeframe bodies”: If true, the indicator draws the shadow of the higher timeframe candle over the current candle.
- “Info panel”: you can enable / disable the dashboard, as well as choose the angle to snap it to.
[spoiler title=”Read More…”]
- Signals from higher timeframes are much more reliable.
- On lower timeframes, use signals only in the direction of the current main trend.
- The best signals appear near support/resistance levels and supply / demand zones.
Take a look at our other products:
[/spoiler]